Oil Rebounds After 2% Drop as Libya Supply Risks and US Inventory Data Weigh
Oil prices rebound after a 2% drop, as Libya supply risks and U.S. inventory declines add to market volatility amid global demand concerns.

Oil markets saw a rebound on Wednesday, recovering from a sharp drop in the previous session that ended a three-day streak of gains.

Investors have been grappling with concerns about potential supply losses from Libya and escalating geopolitical tensions in the Middle East, balanced against worries over global fuel demand.
On Tuesday, oil prices fell more than 2%, snapping a three-day rally that had added over 7% to the market.
Oil bounced off that 200MA as Libya brought some action in the mix pic.twitter.com/CtRaN2RMoQ
— Menthor Q (@MenthorQpro) August 27, 2024
This decline was driven by concerns over low refinery profit margins and weaker-than-expected global consumption growth.
However, new industry data showing a decline in U.S. oil and fuel inventories provided some support, helping prices to recover.
Libyan Supply Disruptions and Geopolitical Tensions
The most significant risk to oil prices remains the potential loss of supply from Libya, where about 1.2 million barrels per day of production are at risk of being shut in due to a political dispute between rival government factions.
🇱🇾⚡ The shutdown of oil production in Libya has begun, the UN warns that the feud threatens chaos, which could lead to the collapse of the economy. pic.twitter.com/DM7Rm7ZlrG
— War Watch (@WarWatchs) August 27, 2024
This situation is compounded by ongoing tensions in the Middle East, where the conflict between Israel and Gaza has the potential to escalate, involving militants in Lebanon and forces from Iran, a key oil producer in the region.
- Libyan Production Risk: Around 1.2 million barrels per day could be halted due to political unrest.
- Middle Eastern Tensions: The Israel-Gaza conflict may involve other regional players, adding further supply risks.
- U.S. Inventory Decline: Crude oil inventories fell by 3.407 million barrels, according to the American Petroleum Institute.
U.S. Inventory Data and Market Outlook
In addition to the geopolitical risks, U.S. inventory data has been a key driver of recent market movements.
According to the American Petroleum Institute, crude oil inventories fell by 3.407 million barrels in the week ending August 23.
Gasoline and distillate inventories also saw declines of 1.863 million and 1.405 million barrels, respectively.
Economic data coming out this morning –
Initial jobless claims 4 week average is down 500K.✅
S&P Global Composite PMI:
54.100 v. 53.500 expected ✅
– Above 50 signals the private economy is generally expanding.S&P Global Manufacturing PMI:
48.000 v. 49.600 expected❌
– Below…— Christopher Inks (@TXWestCapital) August 22, 2024
This drawdown in inventories suggests a tightening supply in the U.S. market, providing some support for oil prices amid global demand concerns.
As traders look ahead to the release of weekly U.S. oil storage data from the Energy Information Administration (EIA), scheduled for Wednesday at 10:30 a.m.
EDT, the market remains sensitive to both supply risks and economic indicators. A continuation of inventory drawdowns could provide further support for oil prices, but the overarching geopolitical and demand-related risks are likely to keep markets volatile in the near term.
WTI Crude Oil Price Forecast: Technical Outlook
WTI Crude Oil is currently trading at $74.93, down 0.74% on the day. The chart indicates a bearish sentiment, reinforced by the price struggling below a downward trendline that has been capping gains since the beginning of August.
The 50-period EMA, currently at $75.20, has acted as a dynamic resistance level. After a brief rally towards the $76.00 region, the price failed to sustain above the 50 EMA and the trendline, signalling potential downside risk.
The RSI is currently at 46.16, edging lower, which suggests weakening momentum and further downside potential.
The immediate support level lies at $74.19, followed by $72.79. A breach below these levels could accelerate the selling pressure, targeting the $71.49 zone.
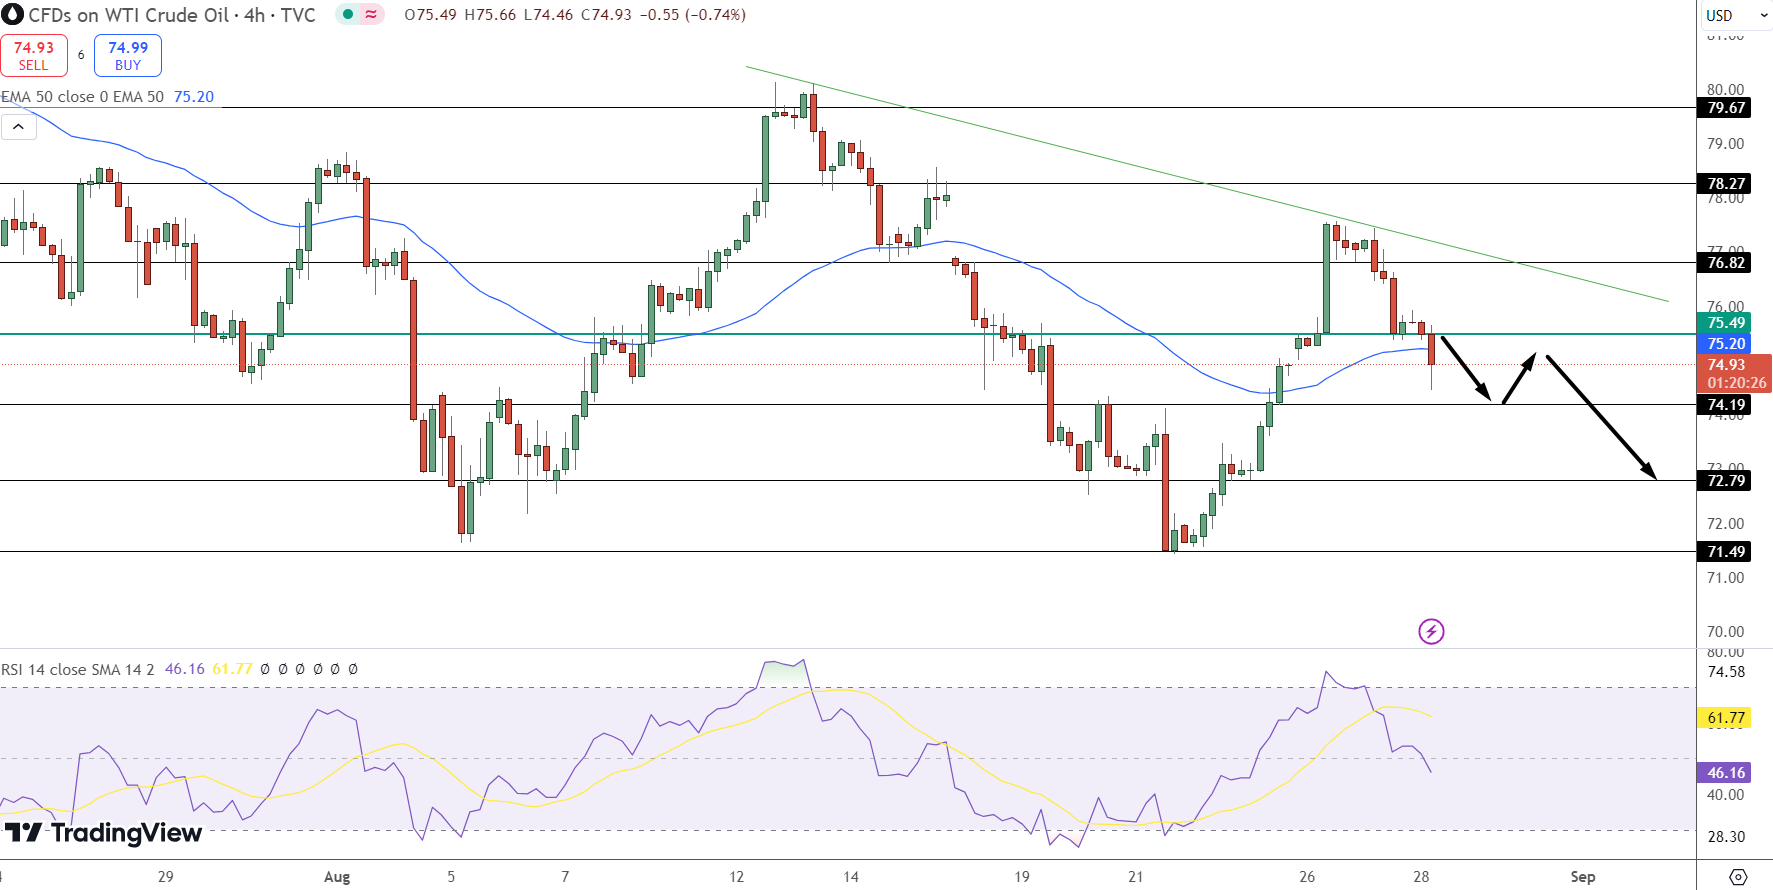
On the upside, resistance is seen at $75.49, where the 50 EMA aligns with the trendline. A break above this level could invalidate the bearish outlook, but until then, the path of least resistance appears to be downward.
Traders should watch for a close below $74.19 as a trigger for further declines. The overall bias remains bearish unless WTI can reclaim and sustain above the $75.49 level.
- Check out our free forex signals
- Follow the top economic events on FX Leaders economic calendar
- Trade better, discover more Forex Trading Strategies
- Open a FREE Trading Account
- Read our latest reviews on: Avatrade, Exness, HFM and XM
Related Articles


Sidebar rates
Related Posts
