Silver Price Prediction: Rising Demand Meets Strong Dollar Impact in 2024
Silver prices remain under pressure as a strong US dollar offsets rising demand. Discover key levels and insights into XAG/USD’s 2024...

Silver (XAG/USD) is currently trading at $30.48, up 0.11%, rebounding from its intraday low of $30.04.

Despite the modest recovery, bearish pressure persists, driven by the strengthening US dollar, which makes silver more expensive for foreign buyers. President-elect Donald Trump’s tariff announcement—25% on Mexican and Canadian imports and 10% on Chinese goods—has bolstered the dollar, further weighing on silver prices.
Adding to market dynamics, optimism in the bond market, triggered by the appointment of Scott Bessent as US Treasury Secretary, has reduced interest in non-yielding assets like silver. However, Federal Reserve commentary provides mixed signals, with officials hinting at potential rate cuts in December, offering mild support for silver prices.
Rising Industrial Demand and Balanced Supply
Despite near-term challenges, silver demand is projected to rise 1% in 2024, reaching 1.21 billion ounces. This growth is fueled by record industrial demand from the solar and electronics industries, along with a rebound in jewelry consumption. India, the largest silver consumer, doubled imports to 4,554 metric tons in the first half of 2024, highlighting robust industrial and investment interest.
[[XAG/USD-graph]]
On the supply side, the Silver Institute forecasts a 4% reduction in the global silver deficit, bringing it to 182 million ounces in 2024. This shift is supported by a 5% increase in recycling and higher production from leading suppliers like Mexico, Chile, and the US. These factors are expected to balance the market, capping significant price surges.
Technical Outlook: Key Levels to Watch
Silver hovers near its pivot point at $30.76, which now acts as resistance. Key support lies at $30.04, with additional levels at $29.72 and $29.39.
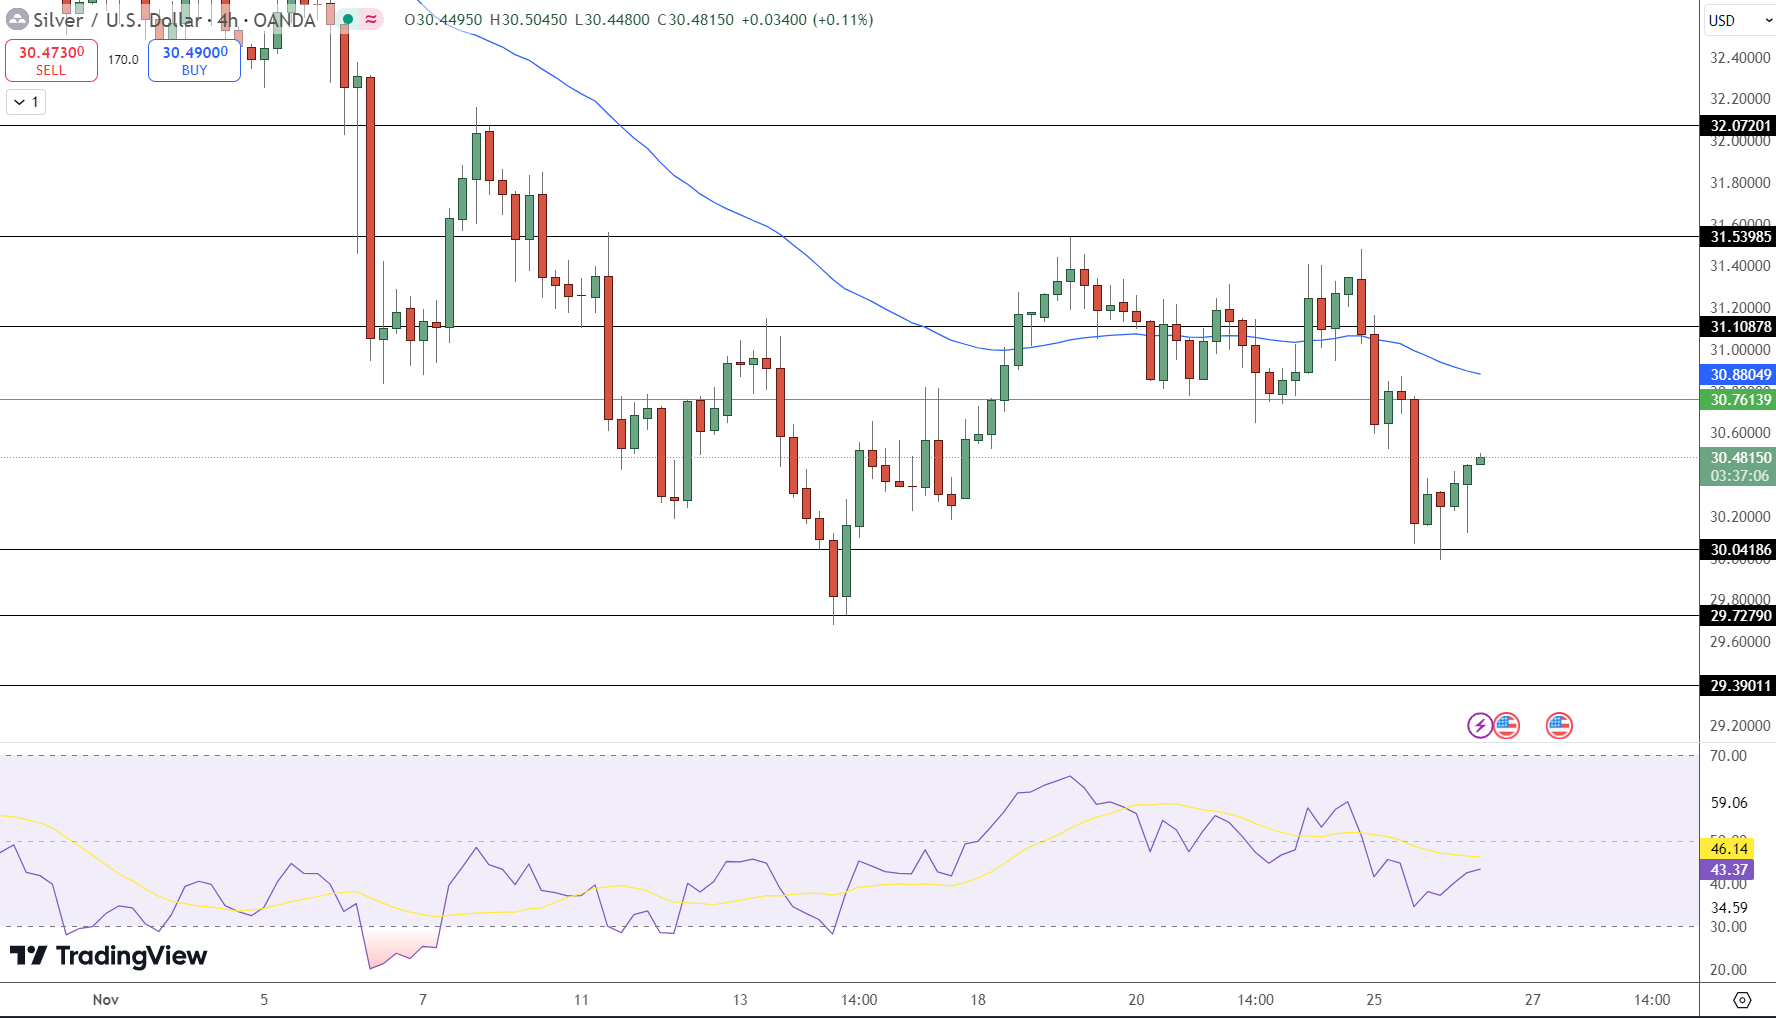
On the upside, resistance is seen at $30.88, followed by $31.10 and $31.53. A breakout above $30.76 could signal a bullish reversal, while failure to hold support may deepen the bearish trend.
Key Indicators:
- RSI: At 43.37, signaling mild bearish momentum.
- 50-Day EMA: $31.10, acting as dynamic resistance.
- 200-Day EMA: $31.53, reinforcing long-term bearish pressure.
A decisive move above $30.76 could shift sentiment upward, while failure to hold support near $30.04 may result in further declines.
- Check out our free forex signals
- Follow the top economic events on FX Leaders economic calendar
- Trade better, discover more Forex Trading Strategies
- Open a FREE Trading Account
- Read our latest reviews on: Avatrade, Exness, HFM and XM
Related Articles


Sidebar rates
Related Posts
