GBP/USD Hovers at $1.2738 as U.S. CPI Data and BoE Policy Awaited
The GBP/USD pair remains under pressure at $1.2738 during the European session, weighed down by the stronger U.S. Dollar.
The GBP/USD pair remains under pressure at $1.2738 during the European session, weighed down by the stronger U.S. Dollar.
The greenback continues to rally, supported by market anticipation ahead of the U.S. Consumer Price Index (CPI) data for November, scheduled for 13:30 GMT. Forecasts suggest an annual CPI increase to 2.7% from 2.6%, with core CPI expected at 3.3%. Monthly CPI figures are anticipated at 0.3% for both headline and core measures.
This inflation report, while unlikely to alter the Federal Reserve’s December 18 rate cut expectations, will provide critical insights into future monetary policy. A Reuters survey found that 90% of economists expect the Fed to lower rates by 25 basis points next week. However, many believe rate cuts could pause in early 2025, contingent on U.S. fiscal policies under President-elect Donald Trump, which might drive inflation higher.
BoE Decision Looms Amid UK Economic Uncertainty
In contrast, the British Pound remains subdued amid a lackluster UK economic calendar. Traders are awaiting the Bank of England’s (BoE) December 19 policy meeting, where rates are expected to hold steady at 4.75%. Persisting inflation concerns and subdued labor market data, such as a four-year low in employment growth expectations, add to market caution.
Upcoming UK economic reports, including GDP, Industrial Production, and CPI, will be pivotal in shaping BoE policy. A recovery in factory output and GDP for October is anticipated, following September’s decline. These indicators will offer clarity on the Pound’s trajectory and BoE’s stance moving forward.
GBP/USD Technical Outlook: December 11, 2024
GBP/USD trades at $1.2738, showing mild recovery. Strong support is observed at $1.2717, aligned with an upward trendline from November. Immediate resistance is at $1.2743, with further hurdles at $1.2764 and $1.2798. A breakout above $1.2798 could drive gains toward $1.2852. However, failure to hold $1.2717 could target $1.2686 and $1.2655.
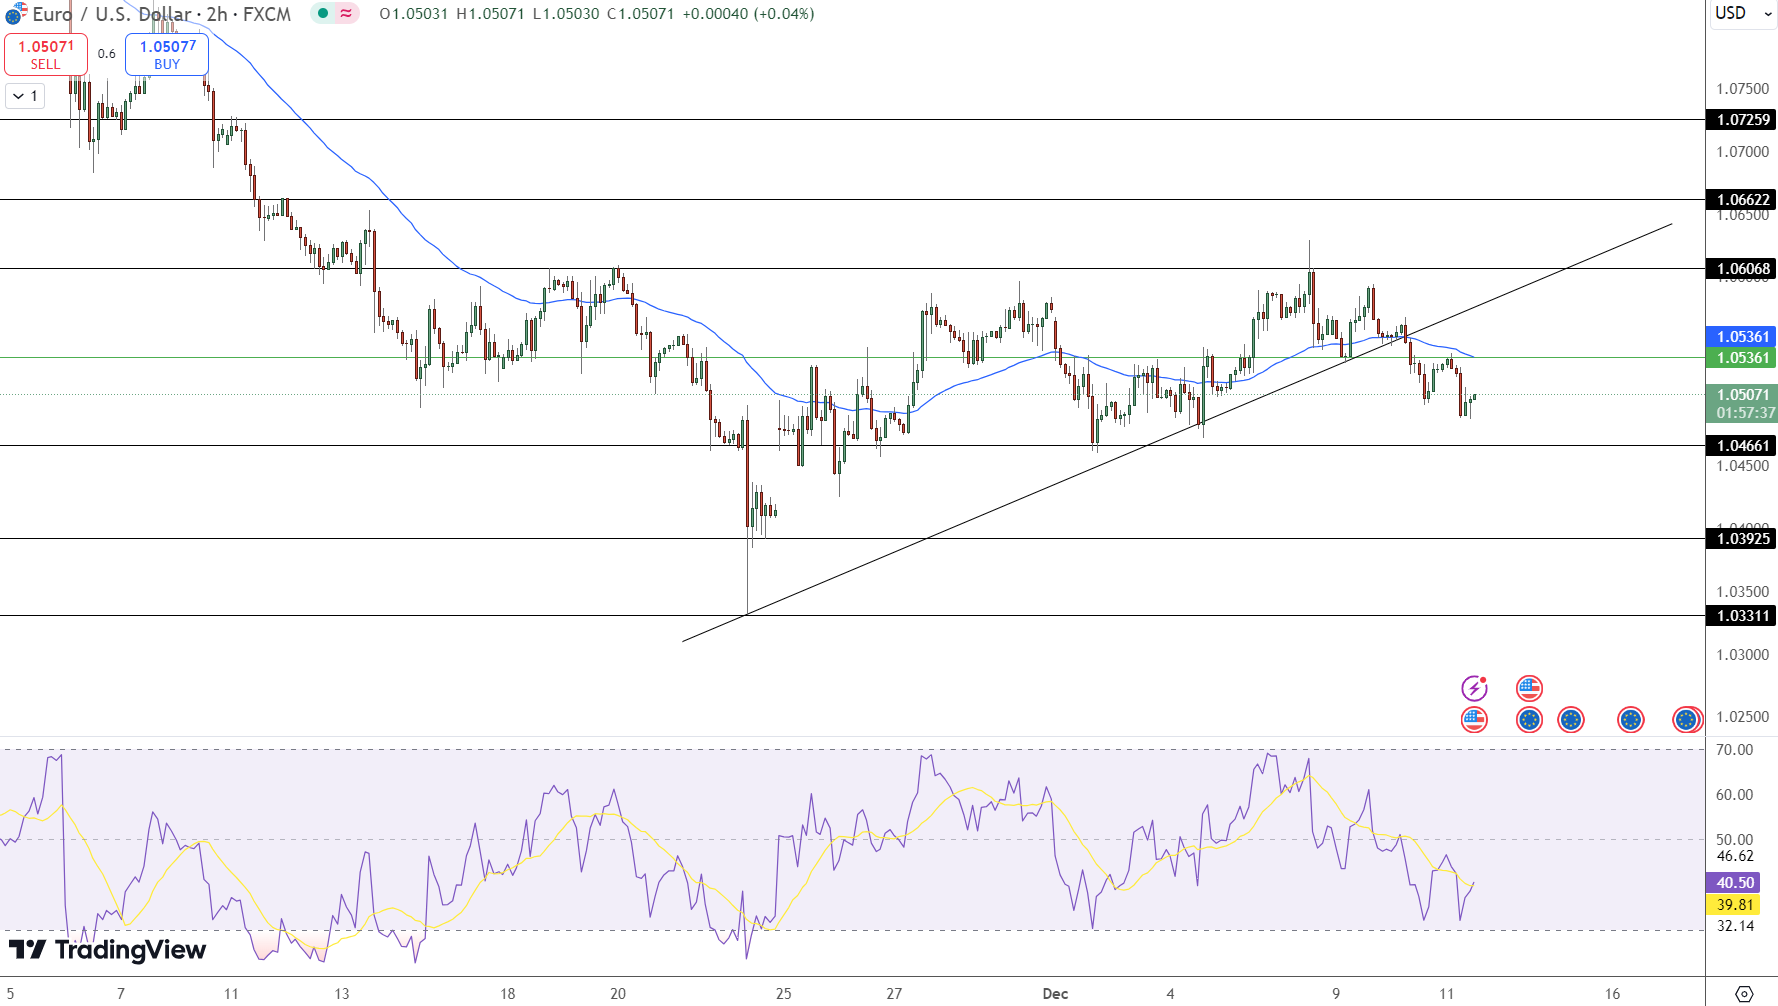
- Support Levels: $1.2717, $1.2686, $1.2655.
- Resistance Levels: $1.2743, $1.2798, $1.2852.
- Technical Indicators: RSI at 45 indicates oversold conditions; the 50 EMA at $1.2745 suggests potential support.
Meta Description:
GBP/USD trades at $1.2738 amid U.S. CPI data and BoE policy anticipation. Key support at $1.2717, resistance at $1.2798. Inflation insights drive sentiment.
- Check out our free forex signals
- Follow the top economic events on FX Leaders economic calendar
- Trade better, discover more Forex Trading Strategies
- Open a FREE Trading Account
- Read our latest reviews on: Avatrade, Exness, HFM and XM
Related Articles


Sidebar rates
Related Posts
