WTI Crude Oil Holds at $70: Bullish Trend Faces Key Resistance
Oil prices showed little movement in Asian trade Thursday, with WTI crude trading at $70.35, down 0.08%. Data from the U.S. Energy

Oil prices showed little movement in Asian trade Thursday, with WTI crude trading at $70.35, down 0.08%.

Data from the U.S. Energy Information Administration (EIA) revealed gasoline and distillate inventories grew more than expected last week, dampening optimism. Rising stockpiles in the world’s largest oil consumer signal potential demand weakness, a concern amplified by OPEC’s forecast downgrade.
OPEC reduced its 2025 demand growth forecast for the fifth consecutive month, citing weak Chinese imports and non-OPEC+ supply expansion. While Chinese crude imports rose 14% annually in November—the first increase in seven months—this is yet to translate into stronger global demand.
The International Energy Agency’s (IEA) upcoming market balance estimates could provide further clarity on demand dynamics.
Geopolitical Factors Add Uncertainty
Oil prices saw a brief uptick Wednesday as the European Union approved a 15th sanctions package targeting Russia’s “shadow fleet,” which has facilitated oil shipments beyond the G7’s $60 price cap. Tensions escalated as the Kremlin criticized potential tightening of U.S. sanctions, with Treasury Secretary Janet Yellen signaling more measures to curb Russia’s oil revenue.
Despite these geopolitical pressures, global oil demand growth has been tempered by reduced jet fuel consumption, according to JPMorgan analysts. Market participants now await signals from the Federal Reserve’s interest rate decision next week, as monetary easing could influence energy demand.
Technical Analysis: WTI Crude Maintains Bullish Trend
WTI crude continues to trade within an upward price channel, supported by the $70.15 pivot. Immediate resistance lies at $70.75, with subsequent targets at $71.50 and $72.15.
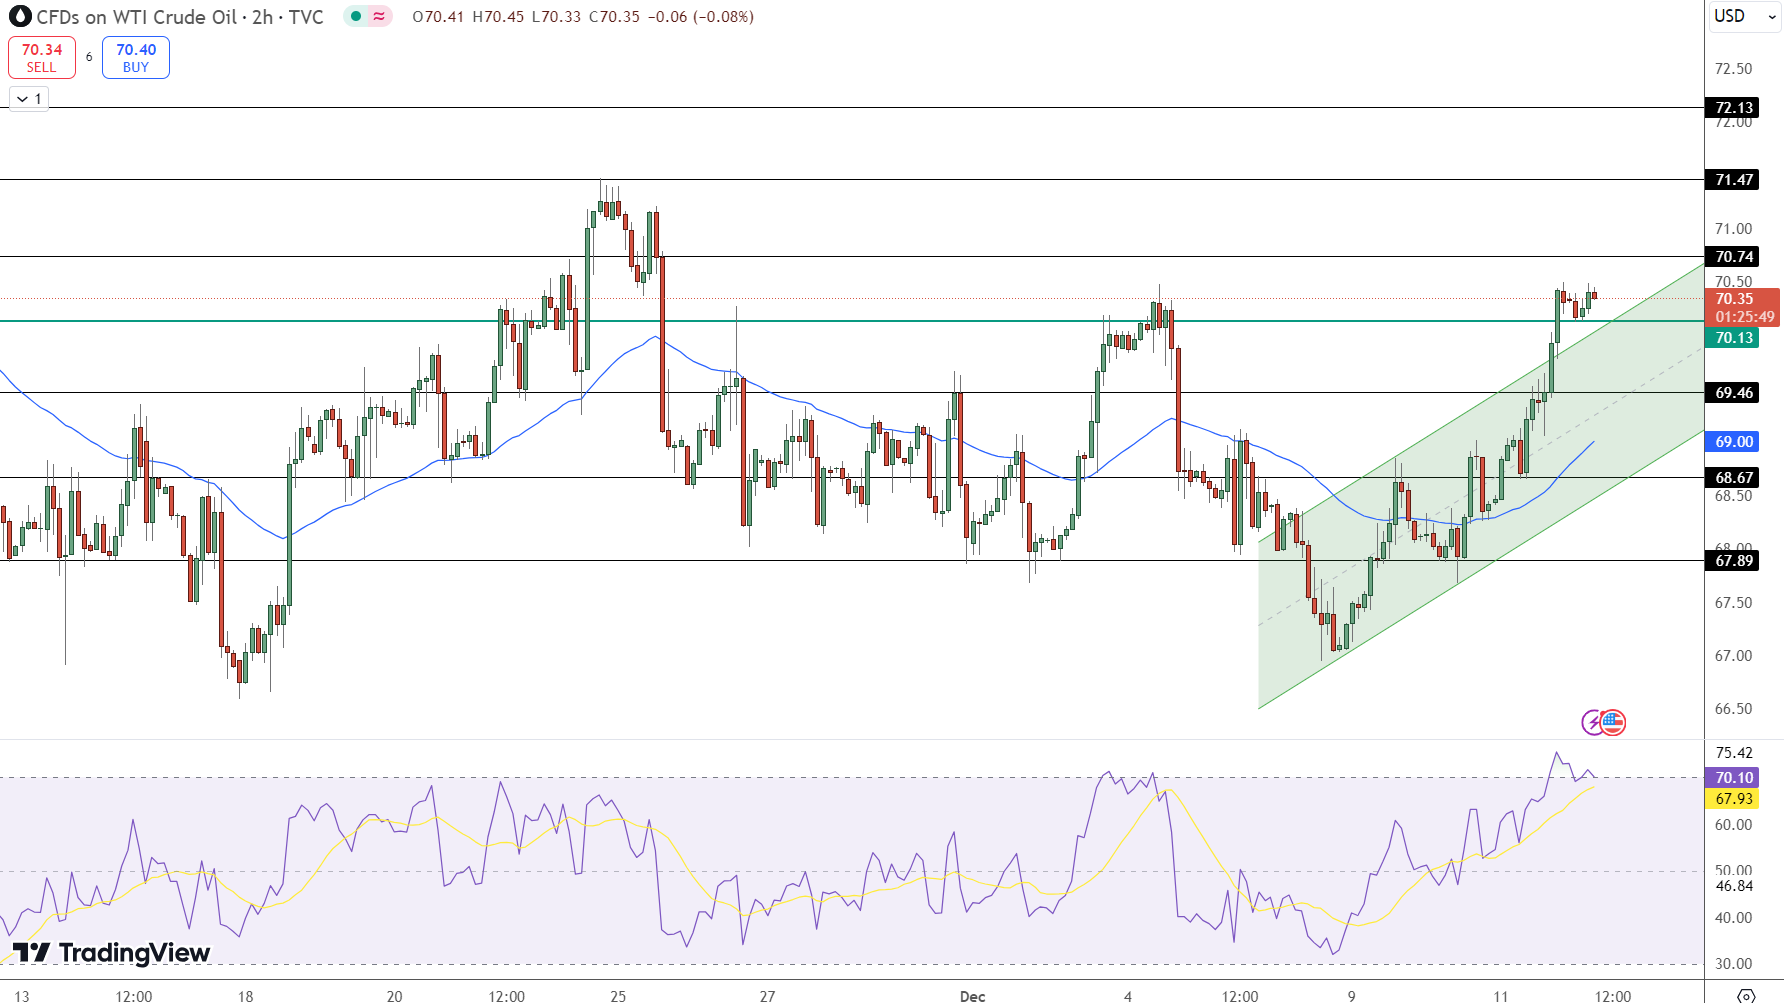
A breakout above these levels could reinforce bullish momentum. However, downside risks emerge if prices fall below $70.15, with support at $69.45 and $68.65.
The RSI at 70.10 indicates overbought conditions, suggesting potential consolidation. The 50-day EMA at $69.00 provides strong technical support for maintaining the uptrend.
Key Insights:
-
Resistance Levels: $70.75, $71.50, $72.15.
-
Support Levels: $70.15, $69.45, $68.65.
-
RSI: 70.10, signaling potential consolidation amid bullish momentum.
Global factors such as geopolitical risks, U.S. inventory data, and OPEC’s outlook are keeping oil prices in a tight range, with technical indicators pointing to cautious optimism.
- Check out our free forex signals
- Follow the top economic events on FX Leaders economic calendar
- Trade better, discover more Forex Trading Strategies
- Open a FREE Trading Account
- Read our latest reviews on: Avatrade, Exness, HFM and XM
Related Articles


Sidebar rates
Related Posts
