US Oil Tests $70 Again After $1 Fall on Lower EIA Crude Inventory Draw
Oil prices climbed $2, but reversed $1 lower in the last hour with US WTI falling to $70, after the smaller drawdown in EIA crude inventory.

Oil prices climbed $2 since yesterday, but reversed $1 lower in the last hour with US WTI falling to $70, after the smaller drawdown in EIA crude inventories.

Oil prices opened with a bearish gap on Monday and continued to decline, dropping below $69 per barrel yesterday. The fall was driven by renewed concerns about China’s economic weakness, which has raised doubts about global energy demand. Earlier in the week, the release of disappointing retail sales data from China underscored sluggish consumer spending in the world’s second-largest oil-consuming nation, further dampening the outlook for oil demand.
US WTI Oil Chart H1 – Staying Close to $70
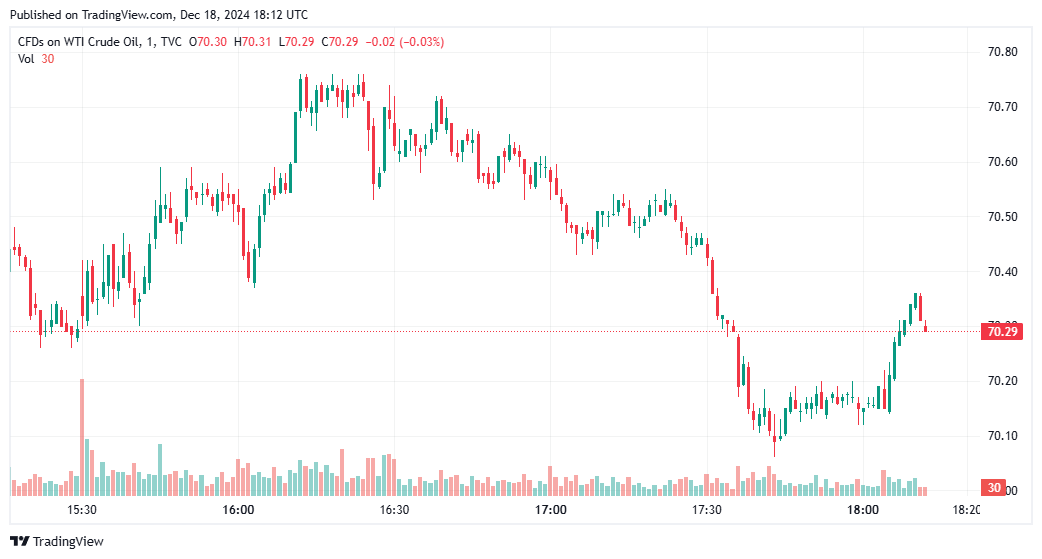
Despite these pressures, geopolitical factors have kept WTI crude prices supported above $70 per barrel. The European Union has implemented its fifteenth round of sanctions against Russia, targeting shadow fleet vessels involved in circumventing oil restrictions. These measures aim to tighten supply and push oil prices higher, maintaining a degree of upward pressure in an otherwise bearish market.
EIA Weekly US Oil Inventories
- Crude Oil Inventories:
- Declined by -934K barrels, below the market expectation of -1635K barrels, indicating a smaller-than-expected drawdown in supplies.
- Highlights continued inventory tightness, though less pronounced than anticipated.
- Gasoline Inventories:
- Rose by +2348K barrels, exceeding the forecasted increase of +2060K barrels, signaling weaker-than-expected demand or higher production levels for gasoline.
- Distillate Inventories:
- Dropped significantly by -3180K barrels, compared to the expected build of +661K barrels, underscoring heightened demand for heating oil and diesel, likely driven by seasonal factors.
- Refinery Utilization:
- Decreased by -0.6%, more than the expected -0.2%, pointing to slightly reduced refinery activity, potentially affecting supply availability in the coming weeks.
Private Oil Data (Released Late Yesterday):
- Crude Oil: Reported a much larger draw of -4700K barrels, diverging significantly from the EIA’s reported draw.
- Gasoline: Increase of +2400K barrels, closely aligned with the EIA’s figure.
- Distillates: Increase of +700K barrels, contrasting sharply with the EIA-reported drawdown, which raises questions about regional inventory fluctuations or reporting discrepancies.
The latest EIA report presents a mixed outlook for US oil markets. A smaller-than-expected crude draw (-934K barrels) and a larger gasoline build (+2348K barrels) suggest easing pressures on supply-demand balances for crude and gasoline. However, the distillate drawdown of -3180K barrels highlights robust seasonal demand, particularly for heating fuels. Private data showing a larger crude draw and differing distillate figures adds uncertainty to inventory trends. Overall, the data underscores the nuanced interplay between supply, demand, and refinery activity heading into winter.
US WTI Crude Oil Live Chart
- Check out our free forex signals
- Follow the top economic events on FX Leaders economic calendar
- Trade better, discover more Forex Trading Strategies
- Open a FREE Trading Account
- Read our latest reviews on: Avatrade, Exness, HFM and XM
Related Articles


Sidebar rates
Related Posts
