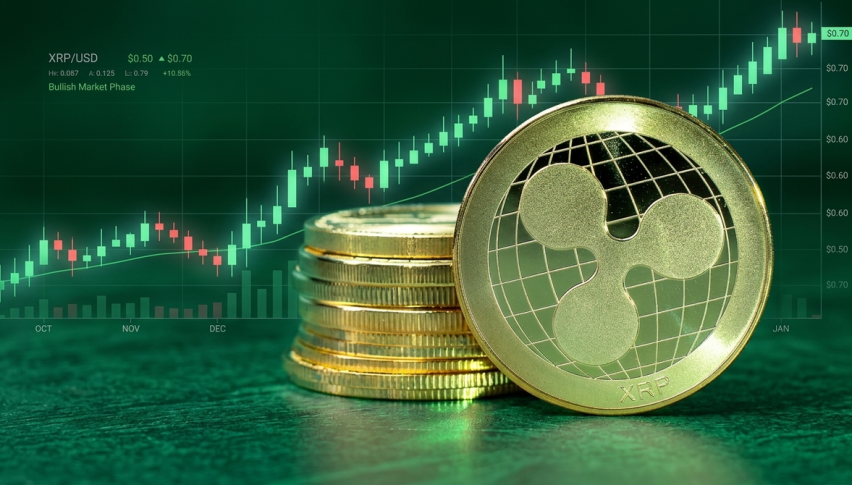
XRP Posts Santa Claus Rally, Short Sellers Burnt
XRP gained more than 5% on Tuesday and with high buying pressure in the altcoin market

XRP gained more than 5% on Tuesday and with high buying pressure in the altcoin market, recent fundamentals showed that key whales in the Ripple-based token held onto their assets despite the wider crypto market sell-off last week.

Prospective bullish catalysts such as the anticipated 2025 launch of an XRP ETF, President-elect Donald Trump, and the January 20 inauguration of a new Securities and Exchange Commission (SEC) administration could cause the holding stance.
The remittance-based token bounced off the triangle’s support trendline around $2.2, and it is currently trying to move higher. Coinglass data indicates that XRP saw liquidations of $5 million for the day. There were $1.73 million and $3.5 million in liquidated long and short positions, respectively.
The altcoin has been in a consolidation phase. However, since the RSI showed a pronounced overbought signal at the start of November, the market has been unable to maintain its upward trend and is currently cooling down and consolidating. However, despite being tested earlier today, the $2.2 support level is intact, driving the price higher toward the $3 level. However, a more significant correction toward the $1.5 level would be anticipated if the $2 level were decisively broken.
XRP may rise to test its all-time high resistance at $3.55 if it breaks through the upper boundary of this triangle pattern. On the other hand, a drop below the lower boundary of the trendline might lead to a sharp drop toward the $1.4 support level. If this happens, the 50-day Simple Moving Average (SMA) and the $2 level may be important support levels.
The momentum indicator of the Relative Strength Index (RSI) is marginally above its neutral level, suggesting that bullish momentum is slightly in control. In the meantime, a crossover to bullish dominance is approaching because the Stochastic Oscillator (Stoch) is just below its neutral level.
- Check out our free forex signals
- Follow the top economic events on FX Leaders economic calendar
- Trade better, discover more Forex Trading Strategies
- Open a FREE Trading Account
- Read our latest reviews on: Avatrade, Exness, HFM and XM
Related Articles
Sidebar rates
Related Posts
