Forex Signals Brief Dec 31: Farewell 2024 With a Bonus from Santa
Today we close 2024, heading into the new year with some nice profit from the trades issued. It was a volatile year, but also with many...

Today we close 2024, heading into the new year with some nice profit from the trades issued. It was a volatile year, but also with many opportunities to trade in financial markets.

U.S. natural gas prices surged by roughly 20% amid forecasts of a harsh January cold spell, while WTI crude oil maintained its bullish momentum, closing the day at $71.50. U.S. equities showed some recovery from session lows but still ended significantly below key levels. The S&P 500 fell 1%, while European markets drifted into modest declines.
Housing Market Update The National Association of Realtors (NAR) reported that November 2024 U.S. pending home sales rose by 2.2%, surpassing the expected 0.9% increase and improving on the revised 1.8% gain from the previous month. The home sales index climbed from 77.4 (revised to 77.3) in October to 79.0 in November. Year-over-year sales also showed strength, rising by 6.9% compared to the previous year’s 5.4% growth. Buyers appear to have stopped waiting for price reductions despite four consecutive months of home price increases. However, the housing market faces pressure from rising mortgage rates, with U.S. 30-year fixed rates climbing above 7% in December—a historically challenging threshold.
Today’s Market Expectations
Yesterday there was some life in financial markets, although it was just noise, with risk currencies tumbling lower in early US session, to recover later, while a similar pattern took place in stock markets. As the final trading day of 2024 unfolds, U.S. market volatility is expected to diminish during the session. Key data to watch includes the S&P/CS Composite-20 HPI y/y, providing an annual comparison of home price trends in major metropolitan areas.
Global Economic Insights China released its official December PMI data early this morning. The Manufacturing PMI edged up slightly to 50.1 points from 50.0 points previously but fell short of the expected 50.3. The Composite PMI improved to 52.2 points from 50.8 points, while the Services PMI jumped significantly to 52.2 points, beating the forecasted 50.2 points.
Yesterday there was some volatility in the markets although without much direction or for any reason, so it was mostly market noise. But it was enough for us to open several trades and and the day with some nice profit. We opened five trading signals in total and ended up with four winning forex signals and a losing trade.
The 100 Daily SMA Turns Into Resistance for Gold
Gold markets remain highly volatile, reflecting changing expectations regarding monetary policy. Last week, gold prices dropped sharply by $100 after failing to surpass the key resistance level of $2,725. The bearish momentum was fueled by strong U.S. services PMI data and anticipation of a Federal Reserve rate cut. Adding to the downward pressure, gold fell below its 100-day Simple Moving Average (SMA), which has since acted as a resistance level. Attempts to climb back above were repeatedly rejected, including a notable failure on Friday. The selloff deepened yesterday, with gold slipping further below the $2,600 mark, signaling continued bearish sentiment. The ongoing market turbulence underscores gold’s sensitivity to macroeconomic indicators and monetary policy shifts, leaving traders on edge as they navigate these uncertain conditions.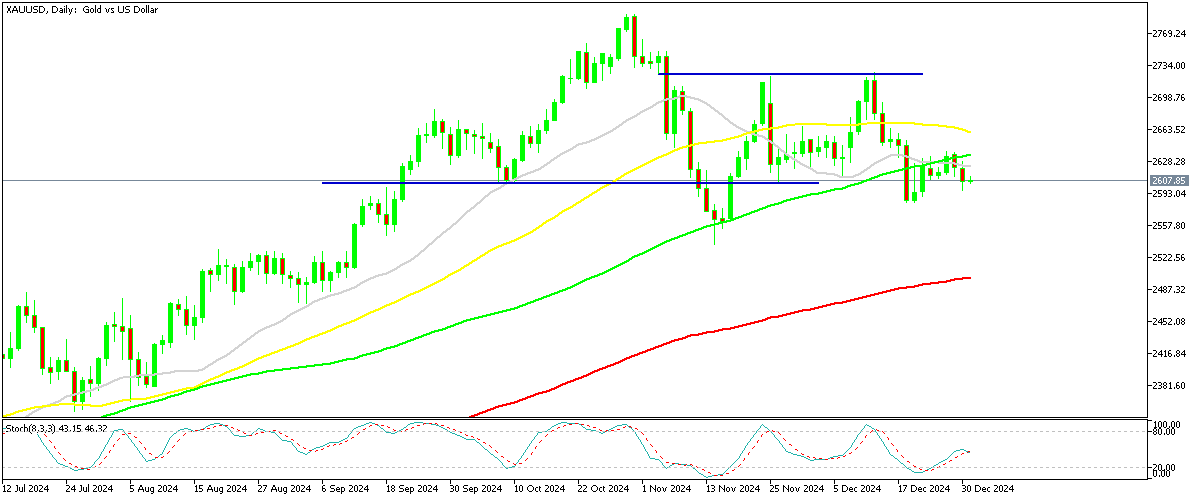
XAU/USD – Daily Chart
MAs Keeping USD/CHF on An Uptrend
USD/CHF continues to remain on a strong bullish trend, having broken above the 0.90 level in December, as safe havens get beaten up, confirmed by the decline in Gold and the surge in USD/JPY. Moving averages are doing a good job acting as support on the H4 chart, with the 20 SMA (gray) taking ovr recently, confirming the strong upside bias.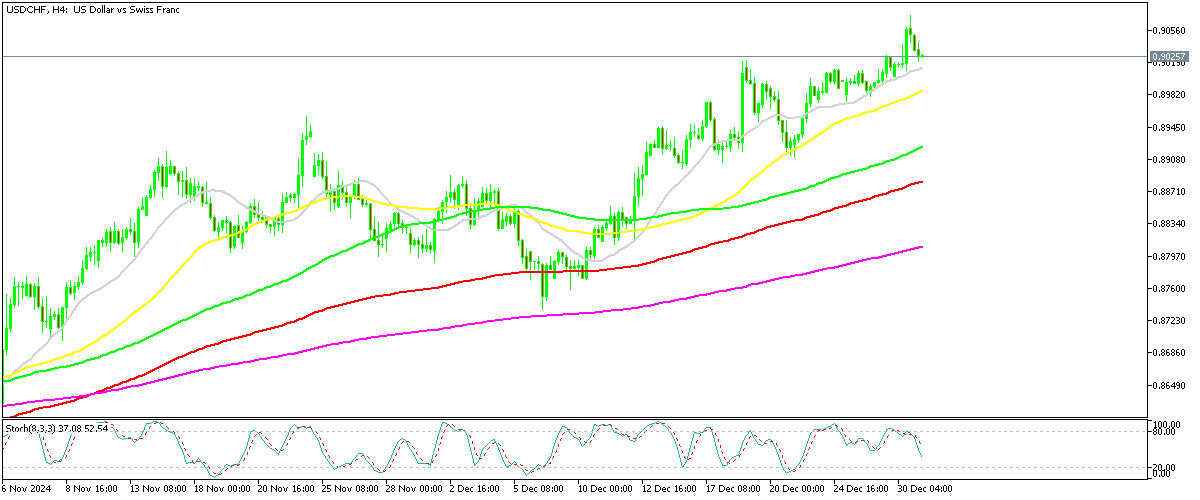
USD/CHF – H4 Chart
Cryptocurrency Update
The $100K Turns Into Resistance for Bitcoin

BTC/USD – Daily chart
Ethereum Heads Toward $3,500 Again
Ethereum also showed significant price swings, rallying from $3,000 to nearly $4,000 midweek. Despite the strong start, it struggled to sustain gains above the $4,000 level after Monday’s initial rise. By the end of the week, Ethereum had dropped below $3,500, deepening its losses.
ETH/USD – Daily chart
- Check out our free forex signals
- Follow the top economic events on FX Leaders economic calendar
- Trade better, discover more Forex Trading Strategies
- Open a FREE Trading Account
- Read our latest reviews on: Avatrade, Exness, HFM and XM
Related Articles


Sidebar rates
Related Posts
