Fuel Stockpiles Surge, WTI Crude Eyes $72 Support Amid Winter Demand Trends
WTI crude oil prices dipped for a second consecutive day, trading at $73.14, down 0.07%, as rising U.S. fuel inventories added pressure...

WTI crude oil prices dipped for a second consecutive day, trading at $73.14, down 0.07%, as rising U.S. fuel inventories added pressure to the market.

Gasoline stockpiles surged by 6.3 million barrels to 237.7 million barrels last week, far exceeding analyst expectations of a 1.5 million-barrel increase. Similarly, distillate inventories rose by 6.1 million barrels to 128.9 million barrels, significantly higher than the anticipated 600,000-barrel build.
Meanwhile, crude inventories fell by 959,000 barrels, slightly missing expectations for a 184,000-barrel draw. Analysts attribute the price dip to these inventory increases and a stronger U.S. dollar, which makes oil more expensive for holders of other currencies.
Hiroyuki Kikukawa, president of NS Trading, noted, “Increased U.S. fuel inventories prompted some selling, but the downside is limited due to the winter demand season in the Northern Hemisphere.”
Winter Demand Supports Global Oil Markets
Despite the inventory-driven decline, analysts expect January to see robust oil demand. JPMorgan forecasts global oil demand to rise by 1.4 million barrels per day (bpd) year-on-year, reaching 101.4 million bpd. This growth is primarily driven by colder-than-usual winter conditions in the Northern Hemisphere, increasing heating fuel consumption. Additionally, early travel activities in China ahead of the Lunar New Year are expected to further boost demand.
The market’s structure also signals supply tightening. Brent futures show a widening backwardation, with prompt contracts trading at a premium to later deliveries, indicating rising concerns over supply constraints amid strong demand.
Technical Outlook: Key Levels to Watch
WTI crude oil hovers around a critical pivot point at $72.84. The 2-hour chart reveals a bearish breakout from an upward channel, signaling a cautious market sentiment. Immediate support levels are at $72.84, followed by $71.79 and $70.94. On the upside, resistance is observed at $73.78 and $74.73.
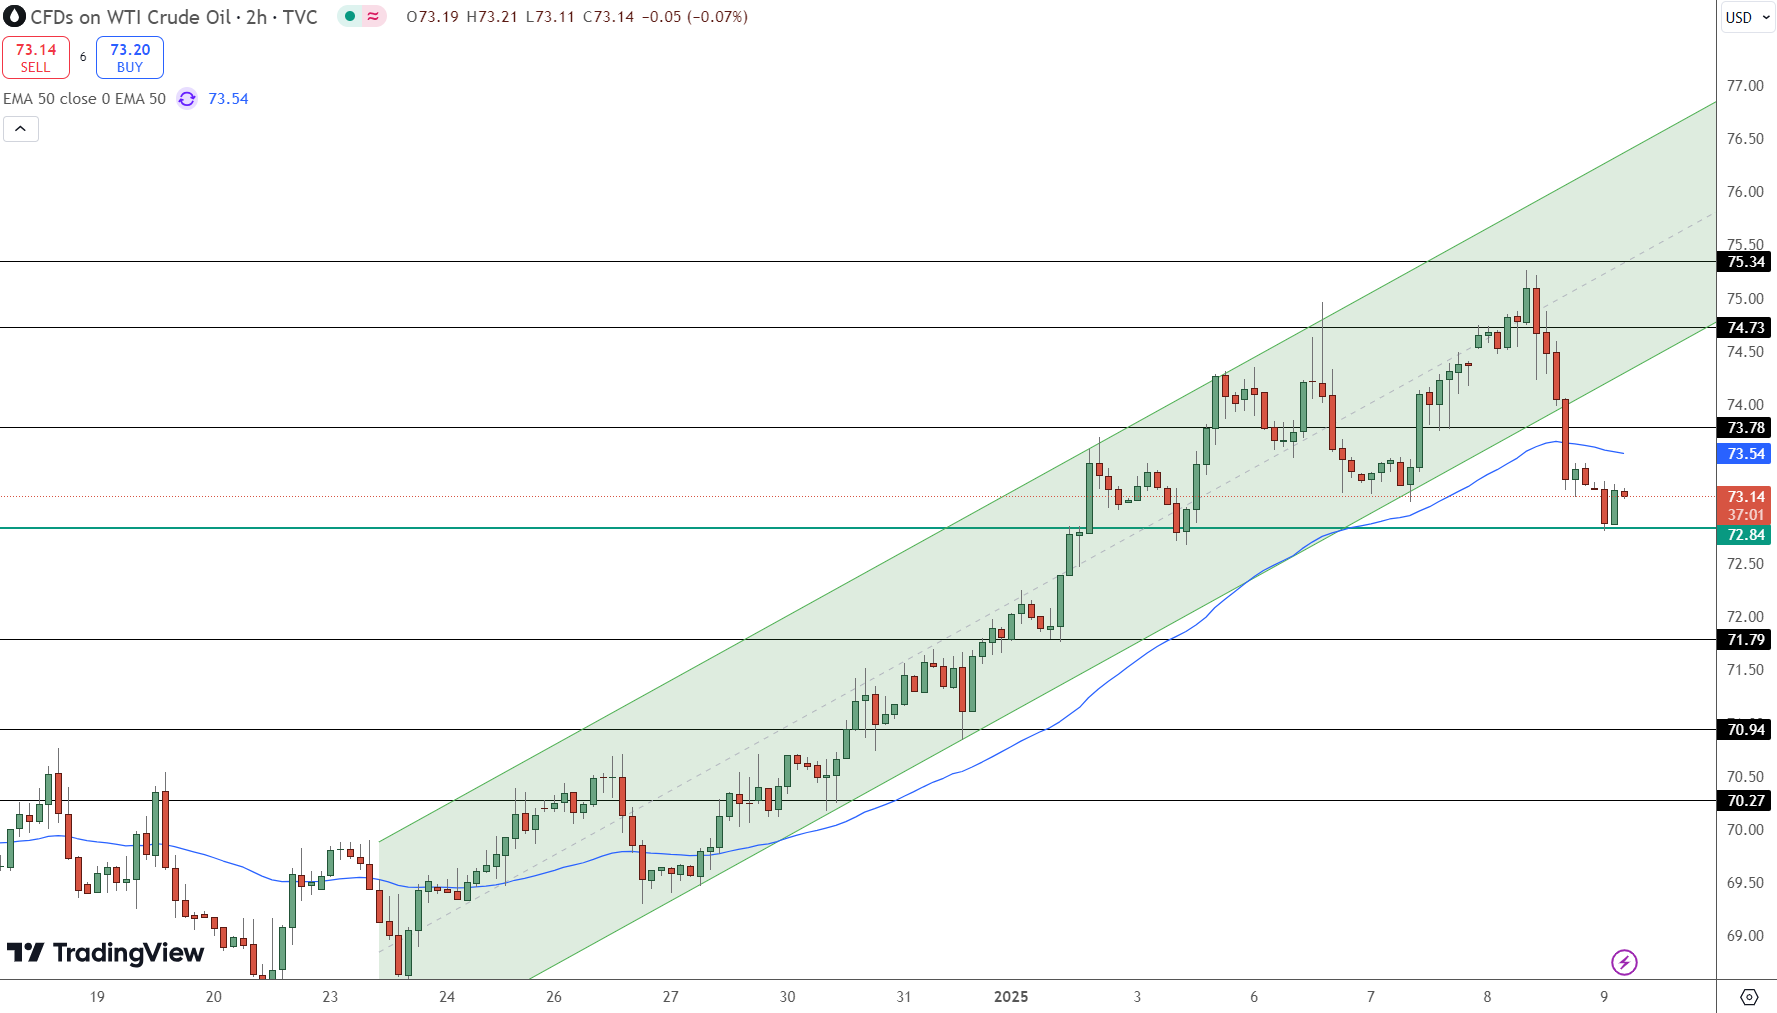
Key technical indicators offer mixed signals. The 50 EMA at $73.54 acts as immediate resistance, while the RSI near oversold territory suggests potential for a short-term rebound. A sustained move below $72.84 could trigger further declines, while regaining ground above $73.78 may spark bullish momentum targeting $74.73.
Key Insights:
-
WTI crude consolidates near $72.84; a break below targets $71.79.
-
Rising U.S. fuel inventories pressure prices despite robust winter demand.
-
RSI signals oversold conditions; watch for potential rebounds above $73.78.
- Check out our free forex signals
- Follow the top economic events on FX Leaders economic calendar
- Trade better, discover more Forex Trading Strategies
- Open a FREE Trading Account
- Read our latest reviews on: Avatrade, Exness, HFM and XM
Related Articles


Sidebar rates
Related Posts
