WTI Crude Pops 6%—Will Russian Sanctions Push Prices to $80?
WTI Crude Oil prices have surged over 6% since January 8, reaching $78.13 as of Monday, driven by widening U.S. sanctions on Russian oil.

WTI Crude Oil prices have surged over 6% since January 8, reaching $78.13 as of Monday, driven by widening U.S. sanctions on Russian oil.

Brent crude climbed above $81 per barrel, its highest in over four months. The U.S. Treasury’s new measures target major Russian oil producers, including Gazprom Neft and Surgutneftegas, alongside 183 vessels transporting Russian oil.
This geopolitical development has disrupted global supply chains, compelling key importers like China and India to shift crude purchases toward the Middle East, Africa, and the Americas. Analysts expect this realignment to elevate crude prices and increase shipping costs.
Goldman Sachs highlighted the potential impact in its latest note:
“The new sanctions strengthen our view that risks to the $70-85 Brent forecast are skewed to the upside in the short term.”
The affected tankers accounted for approximately 25% of Russian oil exports, equivalent to 1.7 million barrels per day in 2024.
Bullish Breakout: Key WTI Price Levels to Watch
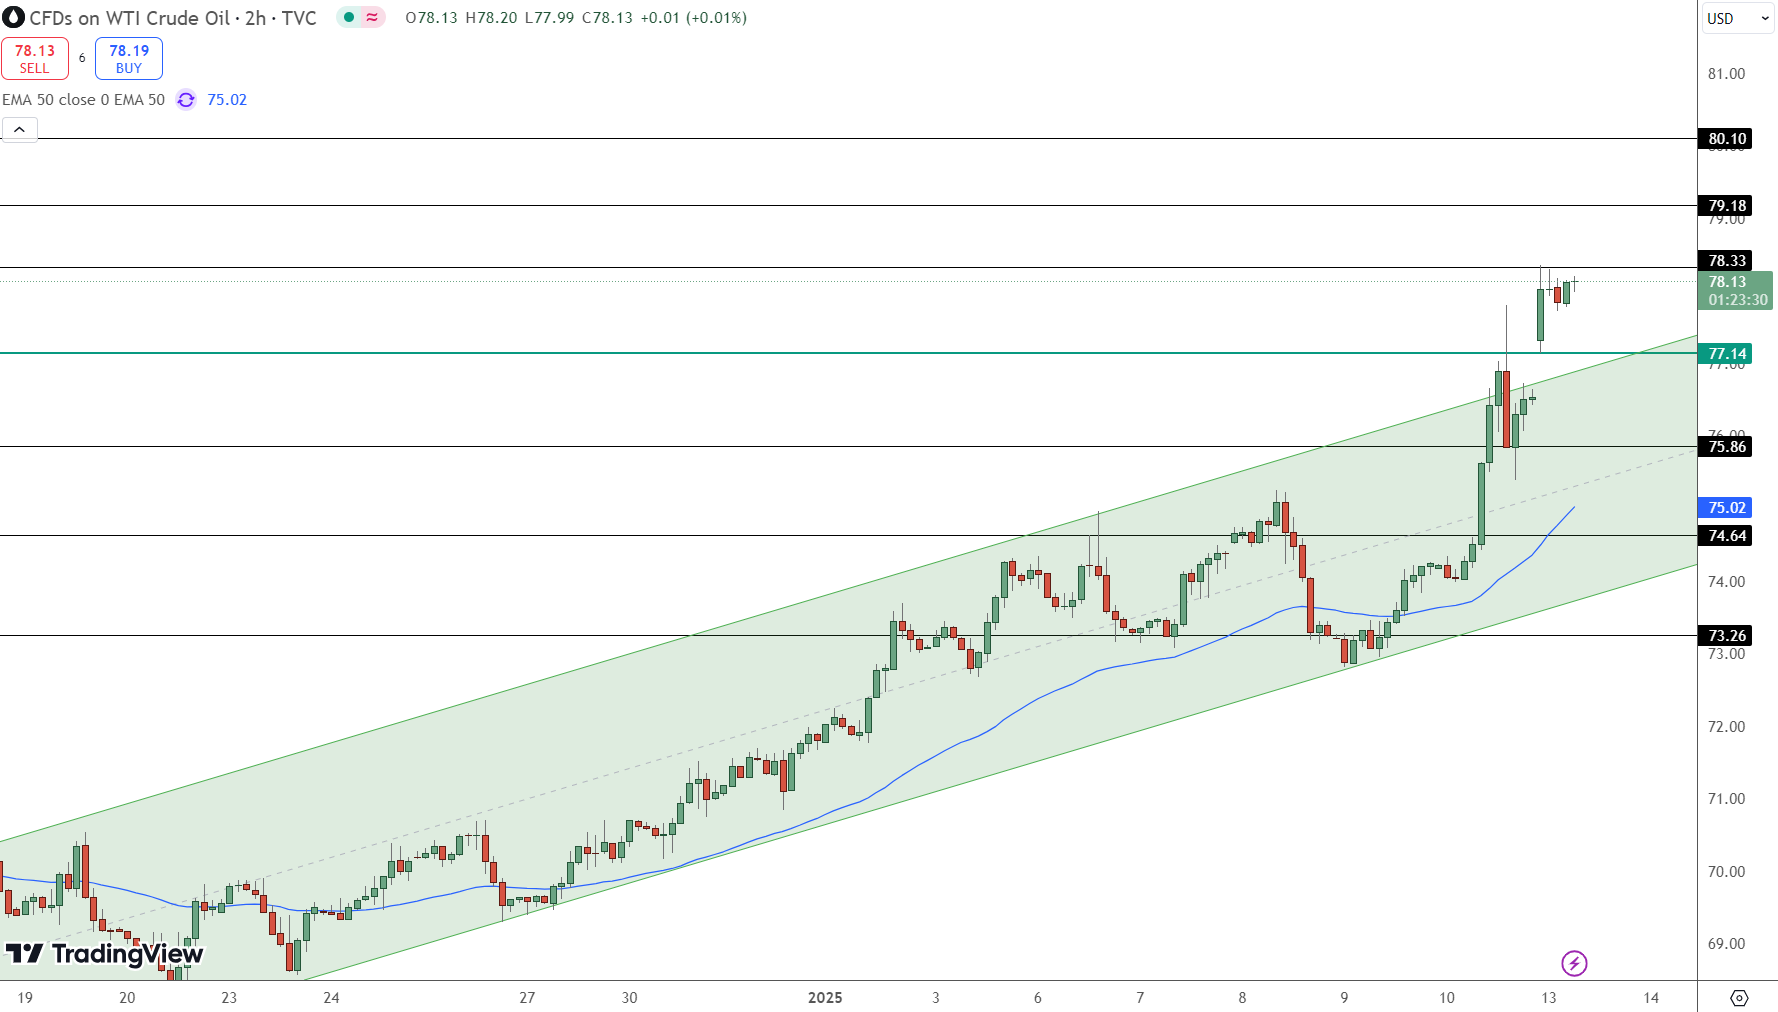
WTI Crude Oil’s bullish breakout above $77.14 signals strong upward momentum, supported by technical indicators and supply constraints. On the 2-hour chart, the price is firmly above the 50 EMA ($75.02), confirming a bullish bias.
Key Levels to Monitor:
-
Immediate Resistance: $78.33
-
Next Resistance Levels: $79.18, $80.10
-
Immediate Support: $77.14
-
Additional Supports: $75.86, $74.64
Technical indicators, such as the RSI, are nearing overbought territory, suggesting possible consolidation before another upward leg. Analysts emphasize that maintaining levels above $78 could act as a springboard toward $80 and beyond.
Impact of Backwardation and Supply Disruptions
Global oil markets are experiencing heightened backwardation, with near-term contracts trading at higher prices than future months. This reflects tight supply and strong demand. WTI and Brent spreads are at their widest levels since Q3 2024, amplifying bullish sentiment.
RBC Capital Markets analysts noted the logistical challenges arising from sanctions:
“Doubling the number of tankers under sanctions poses significant headwinds to crude flows.”
India and China, the primary destinations for sanctioned Russian oil, face logistical hurdles. As shipping alternatives are explored, Middle Eastern producers are poised to benefit from increased demand.
Bullet Point Summary
-
Resistance and Support Levels: WTI Crude Oil is trading above $77.14 with resistance at $78.33 and targets of $79.18 and $80.10.
-
Geopolitical Impact: U.S. sanctions disrupt Russian oil flows, pushing China and India to seek alternative suppliers.
-
Market Dynamics: Tight supply and backwardation in oil contracts fuel bullish momentum, with spreads at 2024 highs.
- Check out our free forex signals
- Follow the top economic events on FX Leaders economic calendar
- Trade better, discover more Forex Trading Strategies
- Open a FREE Trading Account
- Read our latest reviews on: Avatrade, Exness, HFM and XM
Related Articles


Sidebar rates
Related Posts
