JSE Top 40 Set for Breakout? $1.5B Loan and Stock Trading Momentum Build
The JSE Top 40 is up at 88,394 after breaking above its 50-period EMA at 87,707. This is a big shift in sentiment, especially...

Quick overview
- The JSE Top 40 has risen to 88,394 after surpassing its 50-period EMA, indicating a positive shift in market sentiment.
- Traders are awaiting key local economic data to confirm South Africa's recovery, with unemployment still above 32%.
- The Rand has strengthened due to the Iran-Israel ceasefire, boosting global risk appetite and benefiting JSE-listed stocks.
- The JSE Top 40 is forming a symmetrical triangle on the 2-hour chart, suggesting a potential breakout with key levels to watch.
The JSE Top 40 is up at 88,394 after breaking above its 50-period EMA at 87,707. This is a big shift in sentiment, especially in the domestic market where improving sentiment and macro support is driving volumes up.
Traders and investors are now waiting for local data, April business leading indicator and Q1 formal employment numbers, to confirm SA’s economic recovery. Unemployment is still above 32% so these numbers will have a big impact on equity momentum.
Rand Strength and Ceasefire Aid Risk Rally
The Rand strengthened on the news of the Iran Israel ceasefire and global risk appetite is rebounding. The US dollar is soft and emerging market stocks and currencies are in demand. JSE listed stocks are benefiting.
Key macro trends:
- Rand recovery: Off one-month lows
- Ceasefire effect: Global risk appetite rebounding
- Loan timing: Strategic, pre-G20 Summit
Despite long term fiscal concerns the OECD expects debt to be 77% of GDP by 2025. But the World Bank support has given SA credibility in the global financial markets.
JSE Top 40 Technical Setup: Symmetrical Triangle Near Break
On the 2-hour chart the JSE Top 40 is tightening in a symmetrical triangle, a classic setup before a breakout. Price just printed a bullish engulfing candle above the 50-EMA, indicating rising buying pressure.
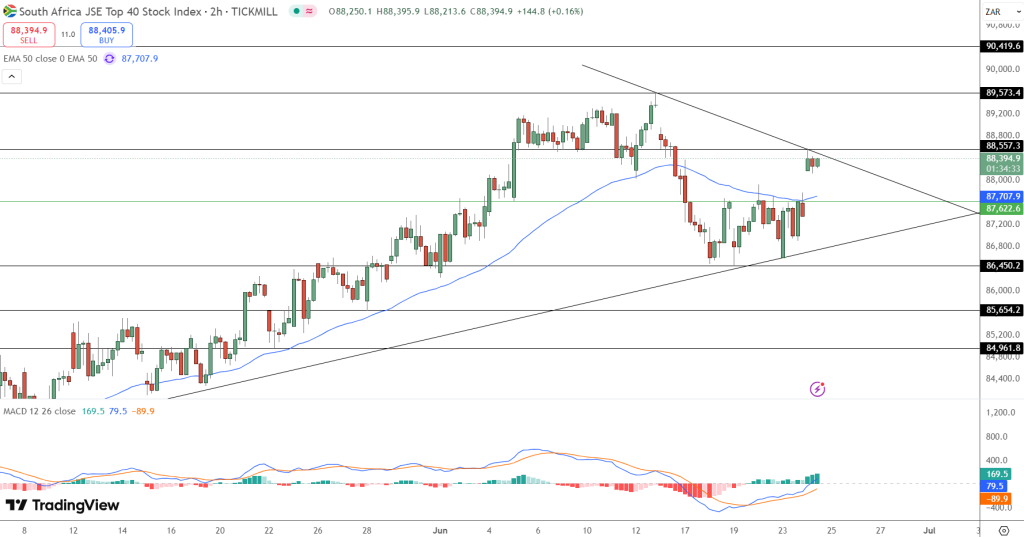
Levels to watch:
- Breakout trigger: Close above 88,557
- Upside targets: 89,573 and 90,419
- Support floor: 87,622
- MACD signal: Bullish crossover with growing histogram
For stock traders this triangle is a coiled spring. A big move – up or down – is coming as price approaches the apex.JSE Top 40 stock trading is hot as technicals and macro’s line up. Global risk is easing and local reforms are accelerating. 90,419 if resistance cracks.
- Check out our free forex signals
- Follow the top economic events on FX Leaders economic calendar
- Trade better, discover more Forex Trading Strategies
- Open a FREE Trading Account
- Read our latest reviews on: Avatrade, Exness, HFM and XM
Related Articles


Sidebar rates
Related Posts
