Google Stock (GOOG) Hits New All-Time High – More Upside To Follow?
Quick overview
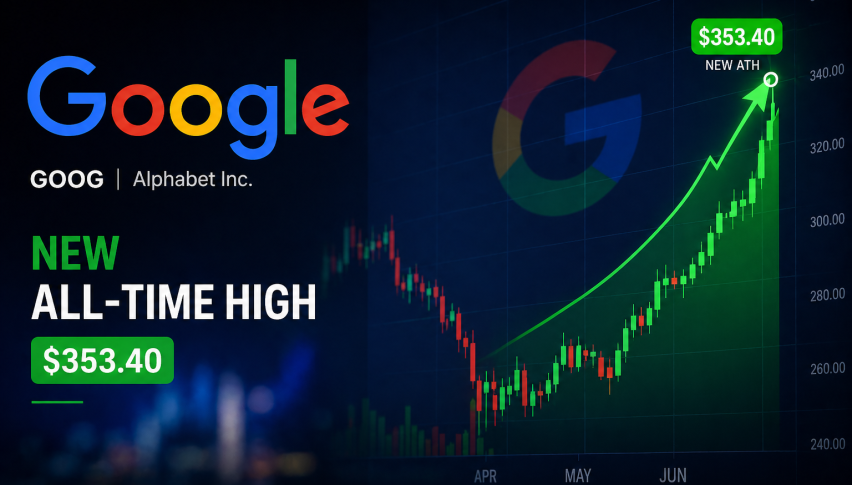
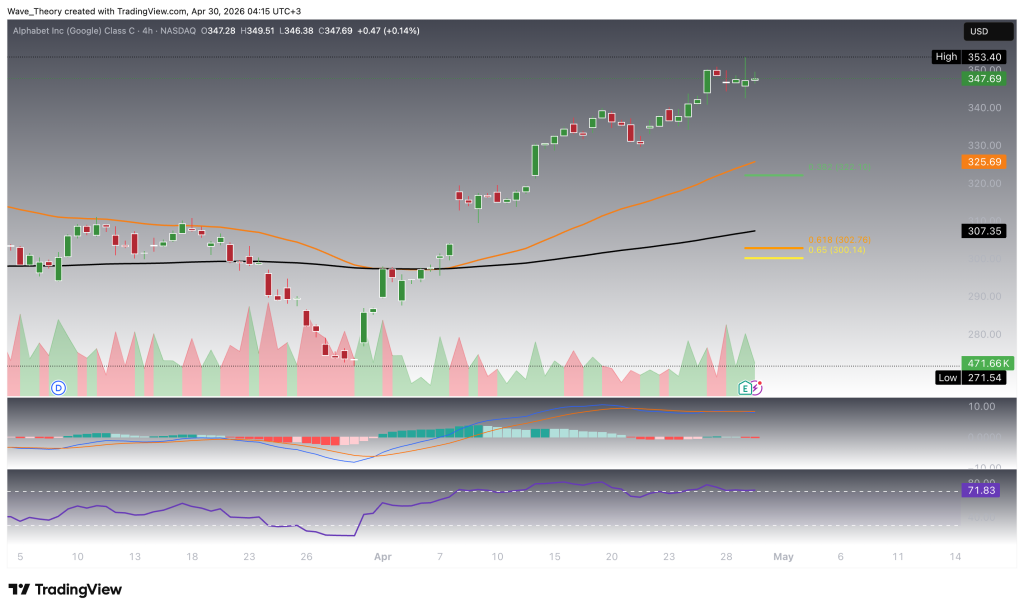
- Google stock (GOOG) surged nearly 23% to a new all-time high of $353.4, reversing a two-month decline.
- While higher timeframes indicate a strong bullish structure, short-term indicators show signs of exhaustion and potential pullback.
- Key support levels to monitor include $322 and $300 for short-term, and $274 for mid-term corrections.
- Despite current momentum cooling, the overall trend remains bullish, suggesting a possible consolidation before further gains.
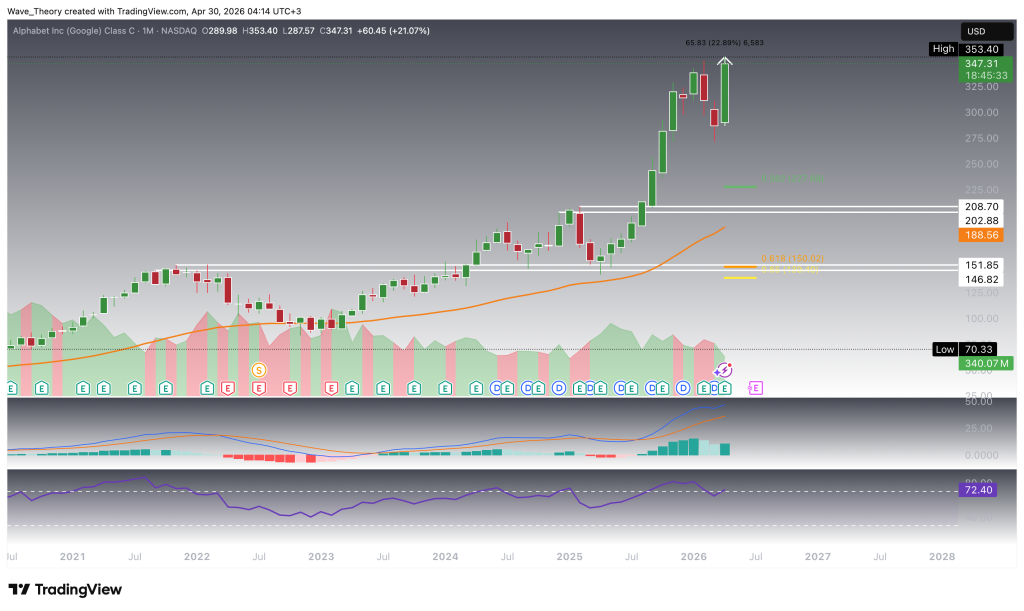
Bullish Structure Strengthens on the Weekly Timeframe
On the weekly chart, Google (GOOG) continues to exhibit constructive bullish structure, reinforcing the mid-term uptrend. The EMAs have formed a golden crossover, a key trend confirmation signal that underscores sustained upside momentum. Complementing this, the MACD setup is on the verge of a bullish crossover, while the MACD histogram has been printing higher for several consecutive months—both indicative of building momentum beneath the surface.
At the same time, the RSI remains positioned in neutral territory, neither overbought nor oversold, suggesting that the trend still has room to extend without immediate exhaustion signals. This balanced momentum profile supports the case for continued upside, provided price structure remains intact.
In the event of a corrective phase, the 50-week EMA emerges as a critical technical level to watch, currently positioned around $274. This level aligns as a key dynamic support zone, likely to attract buyers should price retrace, thereby maintaining the integrity of the broader bullish trend.
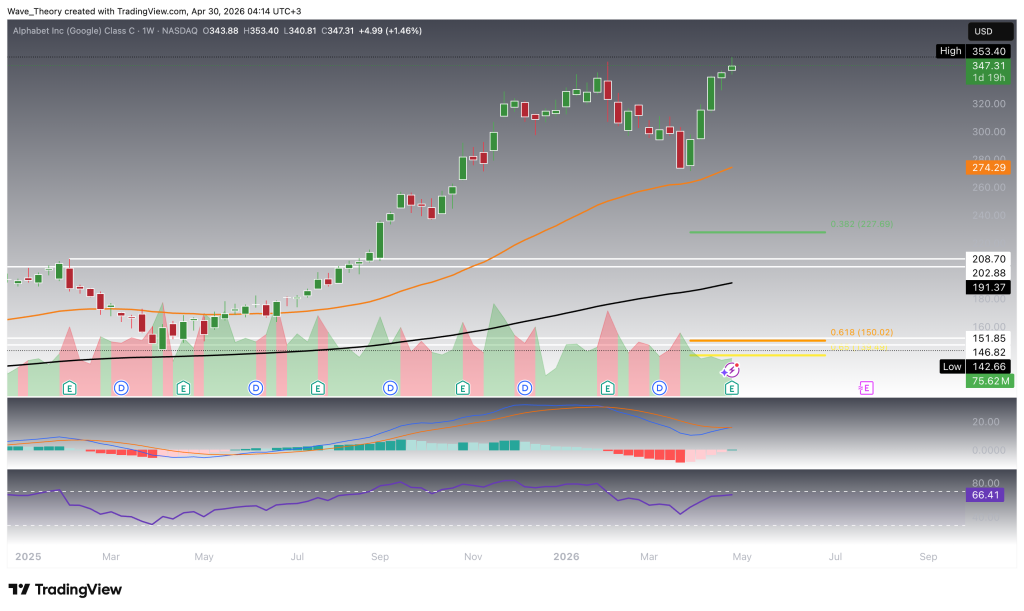
Short-Term Fibonacci Support Levels Define Immediate Risk Zones
In the event of an immediate pullback, Google (GOOG) is supported by well-defined Fibonacci levels at $322 and $300, both of which represent key near-term demand zones within the current uptrend. A deeper retracement would bring the 200-day EMA into focus at $272—a level that has already proven its technical significance, having previously acted as a strong support from which price rebounded bullishly.
From a momentum perspective, the broader structure remains constructive. The MACD lines are firmly bullishly crossed, and the EMAs continue to reflect a golden crossover, reinforcing a bullish bias across the short- to medium-term horizon. However, early signs of short-term momentum cooling are emerging: the MACD histogram has started to tick lower in recent sessions, indicating a deceleration in bullish momentum. Concurrently, the RSI is approaching overbought territory, though without generating a definitive reversal signal at this stage.
Taken together, the trend remains intact, but the confluence of weakening momentum and overbought conditions suggests an increased probability of near-term consolidation or corrective movement into the identified support zones.
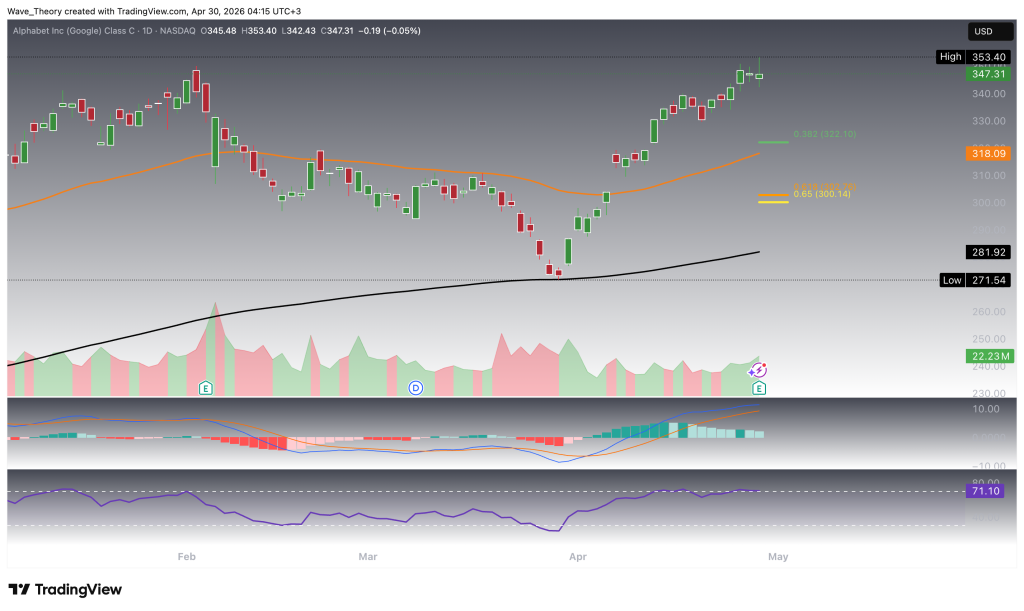
Google Stock at a Critical Inflection Point Between Momentum and Exhaustion
Google (GOOG) remains in a strong multi-timeframe uptrend after rallying ~23% to a new all-time high at $353.4. Higher timeframes (monthly and weekly) continue to support the bullish structure, with golden crossovers and constructive MACD signals reinforcing upside potential. However, short-term indicators – particularly on the 4H chart – are beginning to show signs of exhaustion, including a bearish RSI divergence and weakening MACD momentum, suggesting an increased probability of a near-term pullback or consolidation.
Key Levels to Watch:
- Resistance: $353.4 (all-time high, price discovery above)
- Short-term support: $322, $300 (Fib levels)
- Mid-term support: $274 (50-week EMA), $272 (200-day EMA)
- Major confluence support: $228, $189 (50-month EMA), $150
Overall, the trend remains bullish, but momentum is cooling in the short term – favoring a corrective phase into support before a potential continuation higher.
- Check out our free forex signals
- Follow the top economic events on FX Leaders economic calendar
- Trade better, discover more Forex Trading Strategies
- Open a FREE Trading Account
- Read our latest reviews on: Avatrade, Exness, HFM and XM
Related Articles


Sidebar rates
Related Posts
