FIG Surges 7% on Figma’s Comeback Code: 46% Growth, 139% Retention, and the AI Bet Paying Off
Figma stock surges 7% after Q1 revenue jumps 46%, NDR hits 139%, and AI monetization kicks in. Is FIG's bear market finally over?

Quick overview
- Figma's stock experienced a dramatic decline of nearly 88% from its IPO high, but rebounded after strong Q1 2026 earnings, with a post-earnings surge of approximately 12%.
- The company reported a 46% year-over-year revenue growth, reaching $333.4 million, alongside a significant increase in paid customer count and net dollar retention.
- Figma's strategic focus on AI-driven products and partnerships with major tech firms has contributed to its revenue growth and customer conversion rates.
- Despite impressive metrics, Figma faces risks from competition and the challenge of maintaining high growth rates, while its stock may be overvalued relative to its book value.
Figma’s stock tells a brutal story in numbers. The company reached its all-time high of $142.92 shortly after its IPO on August 1, 2025, then cratered to an all-time low of $16.60 on April 30, 2026 — a collapse of nearly 88% in under nine months. That’s the kind of drawdown that separates belief from conviction. Yet after Q1 2026 earnings, something shifted.
Figma posted its strongest quarterly earnings surprise as a public company, and the market responded accordingly. The stock surged 6.86% in aftermarket trading to $19.97, with pre-market action subsequently pushing it toward $22.00 — a total post-earnings move of roughly 12% from the prior close.
Figma’s Q1 Earnings Reveal 46% Revenue Growth
Revenue acceleration is the headline. Revenue reached $333.4 million in Q1 2026, growing 46% year-over-year — the second consecutive quarter of accelerating growth, up from 40% in Q4 2025 and 38% in Q3 2025. For a company of this scale, re-accelerating growth is not easy, and it’s precisely the kind of evidence that commands a premium multiple.
Customer expansion is genuinely impressive. Paid customer count grew 54% year over year, reaching 690,000, while pro team conversion surged 150% — meaning free users are converting to paid plans at a dramatically higher rate, particularly for AI-powered tools.
The retention metric tells the real story. Net dollar retention climbed to 139%, the highest rate in over two years, up 3 percentage points from the prior quarter. An NDR above 130% means existing customers are expanding their spend faster than any churn can erode — a compounding growth engine that most SaaS companies can only envy.
Unit economics are exceptional. Gross profit reached $275 million at an 82% gross margin, with non-GAAP operating income of $52 million (16% operating margin) and free cash flow of $89 million (27% FCF margin). These are world-class SaaS metrics that demonstrate true pricing power, not just growth at any cost.
Guidance was raised meaningfully. Full-year revenue guidance was raised to $1.422–$1.428 billion, above prior guidance of $1.366–$1.374 billion, implying 35% growth at the midpoint. Q2 guidance of $348–$350 million also landed well ahead of analyst expectations near $327 million.
The one blemish: GAAP net losses remain substantial. Net income for Q1 was −$226.56 million, a significant improvement from the prior quarter’s −$1.10 billion, but losses are largely driven by stock-based compensation. This is a real risk for investors who prioritize GAAP profitability, but it’s also a well-understood structural feature of recently-IPO’d high-growth software companies.
AI Turns Into a Tailwind From Threat for Figma (FIG)
The bear thesis on Figma for much of the past year has centered on AI disruption — the idea that generative design tools from Google, Adobe, and startups would render Figma’s core product obsolete. Q1 2026 results tell a different story.
Revenue growth was driven by international expansion, increased adoption of AI-driven products, and early traction from AI credit monetization, which launched on March 18th. That’s barely six weeks of AI monetization included in the quarter, yet it contributed meaningfully.
CEO Dylan Field articulated the strategic thesis plainly on the earnings call: the bottleneck in software has shifted away from “can we build it” to “can we imagine something worth building,” making design and creativity the new competitive edge.
CFO Praveer Melwani described the outperformance as broad-based, with “all the components” of seat expansion, product adoption, pricing, international momentum, and AI monetization now “kicking into high gear.” That’s not one lucky quarter — that’s a business with multiple growth vectors firing simultaneously.
The company has partnered with Anthropic, OpenAI, and Alphabet to embed generative AI throughout its platform. Figma Make — its AI-powered design-to-workflow tool — is seeing strong enterprise demand. The “pro team conversion” surge of 150% suggests AI features are the hook that’s converting free users into paying subscribers.
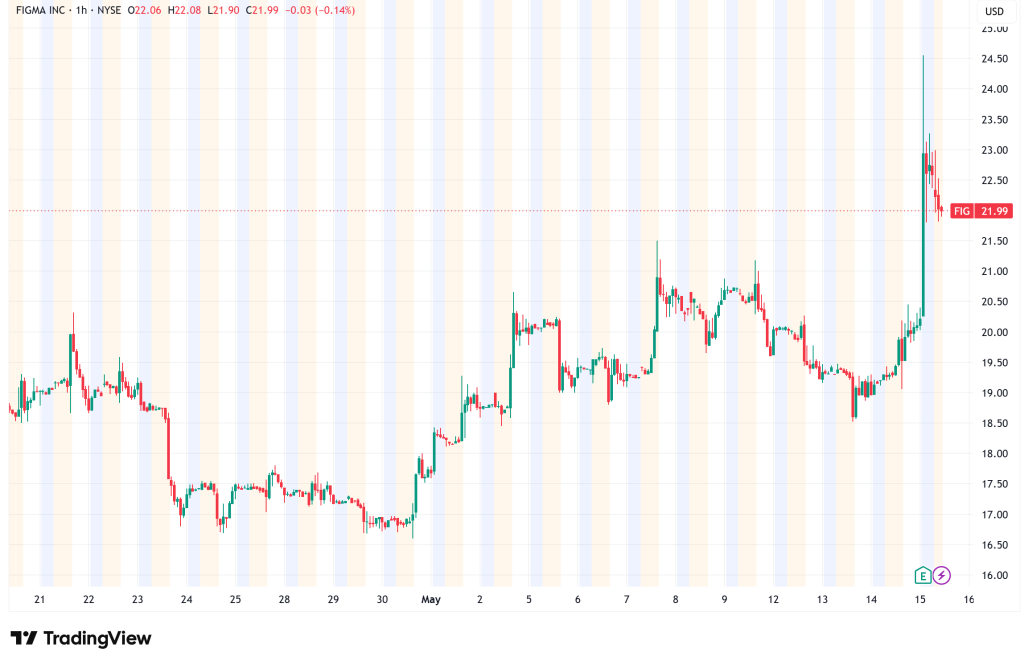
FIG Stock Technical Analysis: A Bombed-Out Chart Attempting a Reversal
The pre-earnings technical picture was unambiguously bearish. The RSI sat at approximately 30.5 over the 14-day period, approaching oversold territory, while the MACD registered −0.73, indicating bearish momentum. The price was trading below both the 50-day moving average ($20.31) and the 200-day moving average ($24.36).
However, the setup contained an interesting technical wrinkle. Community analysts on TradingView flagged a significant RSI divergence — price making lower lows while RSI was making higher lows — a classic precursor to a reversal. Volume was building into earnings, lending some credibility to that signal.
Key resistance sat at $19.55–$19.90, with support derived from accumulated volume at $18.92. The post-earnings surge to $22+ means the stock has cleared those resistance levels, but now faces its next test: the 50-day moving average at $20.31 (which may have shifted slightly) and the broader downtrend channel that has defined the stock since its IPO peak.
How Will Figma Stock Move in Q2 2026?
In the bull case, the post-earnings gap holds above $20, the stock consolidates before attempting a move toward the 200-day MA near $24–$25, and sustained positive data on AI monetization through Q2 brings longer-term institutional buyers back. A gradual reclaim of the downtrend channel would put $25–$30 in play over the next two to three quarters.
In the bear case, the earnings pop is absorbed and the stock drifts back toward the $17–$18 range as growth-skeptic selling resumes. The stock has a beta of only 0.59, suggesting relatively low correlation with broader market moves — so any retest of lows would be fundamentals-driven rather than macro-driven.
Figma’s Long-Term Potential: A Genuine Platform Company
Figma offers tools for the entire lifecycle of software creation — FigJam, Figma Slides, Figma Design, Figma Draw, Dev Mode, Figma Sites, Figma Buzz, and Figma Make — and is increasingly expanding from a design tool into a full product development platform. That platform ambition is what justifies a premium valuation and distinguishes it from single-purpose SaaS.
The TAM expansion is real. As AI reduces the cost of code execution, design and product specification become the bottleneck — exactly the workflow Figma owns. If the company can successfully monetize AI credits at scale and continue converting free users at current rates, the trajectory to $2 billion in annual revenue by 2027 is credible.
Despite the post-earnings surge, InvestingPro analysis indicates the stock may be overvalued relative to its Fair Value estimate, with a Price/Book multiple of 6.61. That caveat is worth respecting — the stock is not cheap even at current prices relative to its book value. But for a company growing revenue 46% with 82% gross margins, 139% NDR, and an accelerating AI monetization curve, the traditional valuation frameworks are imperfect tools.
The risks are real: competition from Google’s updated Stitch platform and Adobe Firefly remains a genuine threat, sustaining 40%+ growth rates gets progressively harder, and the stock’s distance from its IPO price creates persistent overhang from early investors looking to exit.
- Check out our free forex signals
- Follow the top economic events on FX Leaders economic calendar
- Trade better, discover more Forex Trading Strategies
- Open a FREE Trading Account
- Read our latest reviews on: Avatrade, Exness, HFM and XM
Related Articles

Sidebar rates
Related Posts
Ava

