Oracle Stock Down 30%: Has the Recovery Rally Ended?

Quick overview
- Oracle stock has experienced a significant decline of roughly 30% this month, returning to the Golden Ratio support near $175.
- A breakout above the 0.382 Fibonacci resistance at $215 could strengthen the bullish outlook and pave the way for a challenge of the critical Golden Ratio resistance at $272.
- Current indicators provide mixed signals, with bullish momentum on lower timeframes but persistent bearish pressure on the daily chart.
- If Oracle fails to hold the Golden Ratio support at $175, the next major downside target is the support level near $122.
Oracle stock previously plunged more than 60% from its all-time high near $356, recorded last summer. Since then, the stock has staged a strong recovery rally, reclaiming a significant portion of its losses. However, the broader correction phase has not yet been invalidated. Instead, Oracle faced renewed selling pressure and has fallen roughly 30% this month alone. As a result, investors are now watching closely to determine whether the recent pullback represents a healthy retracement within the recovery trend or the beginning of another leg lower.
Oracle Stock Bounced Strongly From Key Golden Ratio Support
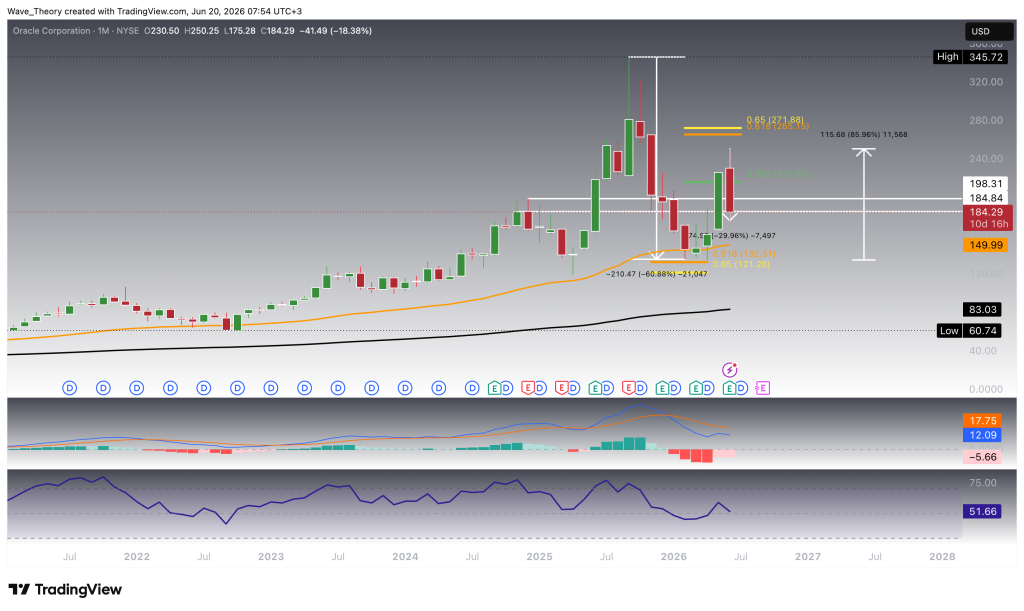
Following its sharp decline of more than 60% from the all-time high near $356, Oracle reached the Golden Ratio support around $130. From there, the stock staged an impressive rebound of roughly 86%.
Last month, Oracle successfully broke above the 0.382 Fibonacci resistance at $216 and appeared on track to challenge the critical Golden Ratio resistance at $272. A decisive breakout above this level would invalidate the ongoing correction phase and significantly strengthen the bullish outlook.
In that scenario, Oracle could revisit its all-time high near $356 and potentially establish new record highs. However, before reaching this key resistance, the stock experienced a sharp reversal. Oracle has declined by roughly 30% this month, erasing a significant portion of its recovery gains.
As a result, the stock has returned to a major historical support zone between $185 and $198. The monthly indicators currently provide mixed signals. The MACD histogram has been ticking higher since last month, reflecting improving bullish momentum. At the same time, the EMAs maintain a Golden Crossover, confirming the long-term trend remains bullish.
Meanwhile, the RSI continues to move in neutral territory, offering no clear directional bias. In contrast, the MACD lines remain bearishly crossed, indicating that the broader correction has not yet been fully resolved.
Stock Price Returns to Golden Ratio Support
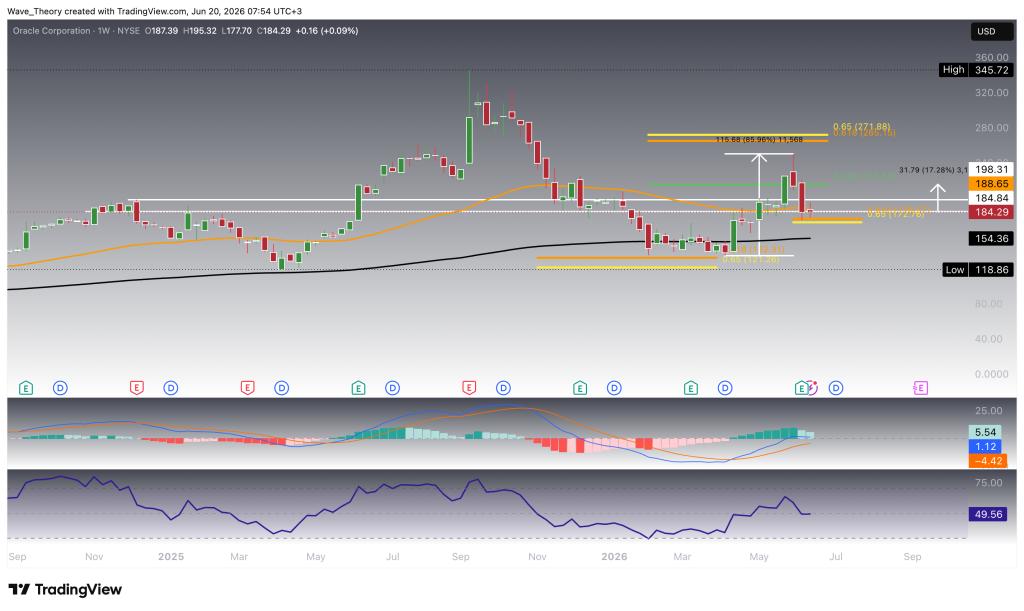
Oracle failed to reach the critical Golden Ratio resistance at $272. Instead, the stock reversed sharply and has now returned to the Golden Ratio support near $175.
As long as this support holds, Oracle could stage a bullish rebound toward the 0.382 Fibonacci resistance at $215. Such a move would imply upside potential of roughly 17%. If the current support level fails, the next major downside target sits at the Golden Ratio support near $122. This level represents the next significant technical support zone.
The weekly indicators currently provide mixed signals. The RSI remains in neutral territory, offering no clear directional bias. At the same time, the MACD lines and EMAs maintain a bullish configuration. This confirms that the medium-term trend remains constructive despite the recent correction.
However, momentum has started to weaken. The MACD histogram has been ticking lower since last week, signaling increasing bearish pressure in the short term.
Golden Crossover Emerged, But a Death Cross Threatens
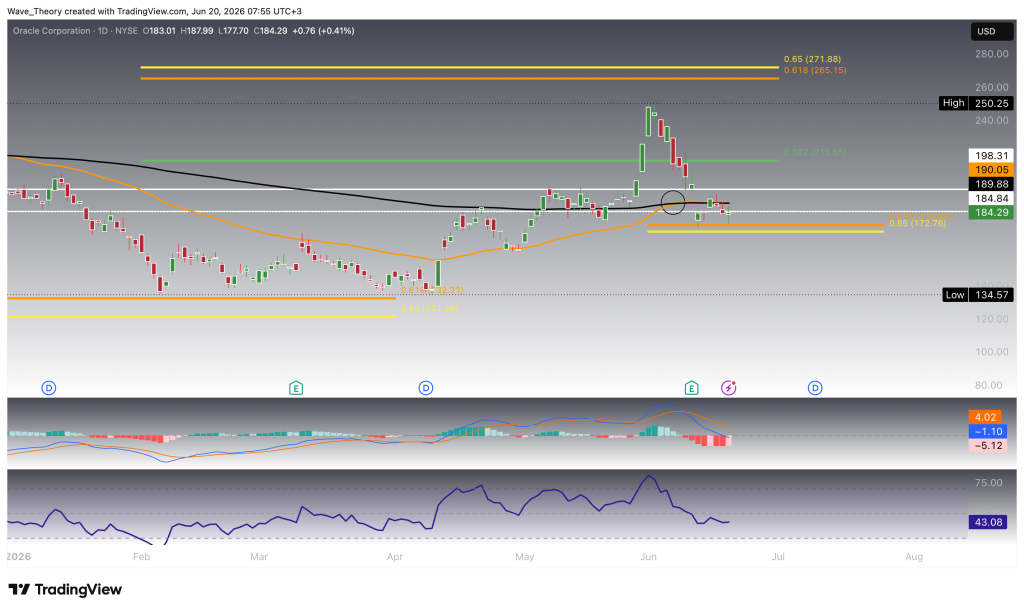
On the daily chart, the indicators continue to send mixed signals. The MACD lines remain bearishly crossed, reflecting persistent downside pressure. However, the MACD histogram has started to tick higher today, indicating that bearish momentum may be weakening.
Meanwhile, the EMAs recently formed a Golden Crossover, which is typically considered a bullish signal. However, this bullish setup remains fragile. The EMAs are currently converging and could soon invalidate the Golden Crossover by forming a Death Cross instead.
As a result, the short-term trend remains at a critical inflection point. At the same time, the RSI continues to move in neutral territory, providing no clear directional signal.
Golden Crossover Strengthens the Short-Term Outlook for Oracle Stock
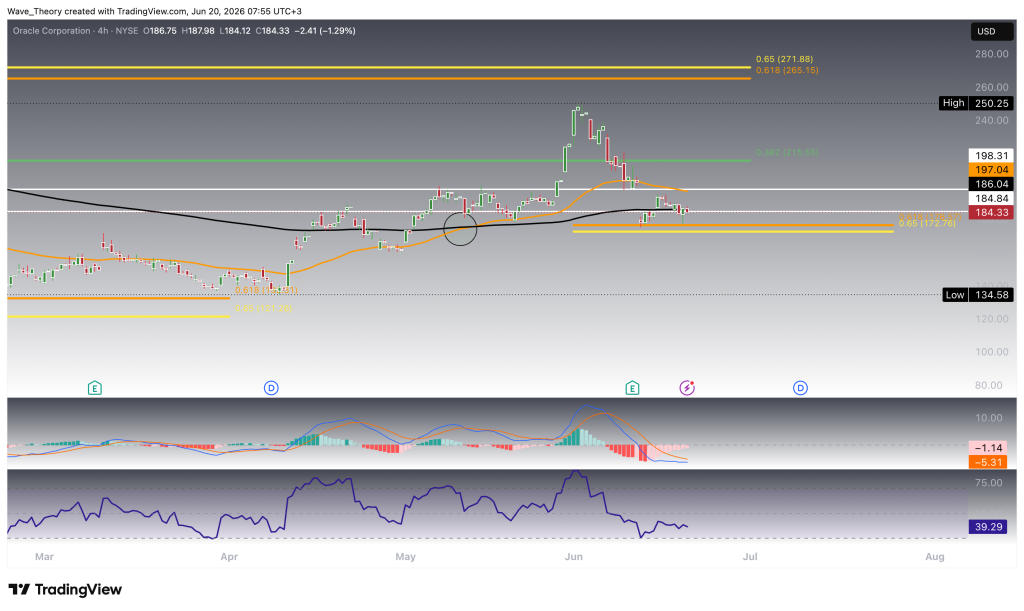
On the 4-hour chart, the EMAs have established a Golden Crossover, confirming a bullish short-term trend.
Momentum indicators are also improving. The MACD histogram has been ticking higher for several consecutive days, reflecting strengthening bullish momentum. In addition, the MACD lines are on the verge of a bullish crossover, which would further support the bullish outlook.
As long as Oracle holds above the Golden Ratio support at $172, the path of least resistance remains to the upside in the short term. A sustained hold above this support level could provide the foundation for a broader recovery move in the coming sessions.
Oracle
Oracle Stock Forecast: Summar
Oracle remains at a critical technical juncture after declining roughly 30% this month. The stock has returned to the Golden Ratio support near $175, which now serves as the most important support level in the short to medium term. As long as Oracle holds above this level, the recovery structure remains intact.
To the upside, the first major resistance sits at the 0.382 Fibonacci level near $215. A breakout above this resistance would strengthen the bullish case and open the door for a move toward the critical Golden Ratio resistance at $272. Only a decisive break above $272 would invalidate the broader correction phase and pave the way for a retest of the all-time high near $356.
If Oracle loses the Golden Ratio support at $175, the next major downside target lies at the Golden Ratio support near $122.
The indicators currently provide mixed signals. The monthly and weekly EMA structures remain bullish, while the 4-hour chart displays a Golden Crossover. At the same time, the daily MACD remains bearishly crossed, and bearish momentum has not fully disappeared. Nevertheless, improving momentum on lower timeframes suggests that Oracle could attempt a short-term recovery as long as support at $175 holds.
- Check out our free forex signals
- Follow the top economic events on FX Leaders economic calendar
- Trade better, discover more Forex Trading Strategies
- Open a FREE Trading Account
- Read our latest reviews on: Avatrade, Exness, HFM and XM
Related Articles


Sidebar rates
Related Posts
