GBP/USD Facing the 20 SMA on the Monthly Chart
GBP/USD has made quite a reversal this year but it is now facing the 20 SMA as a resistance indicator
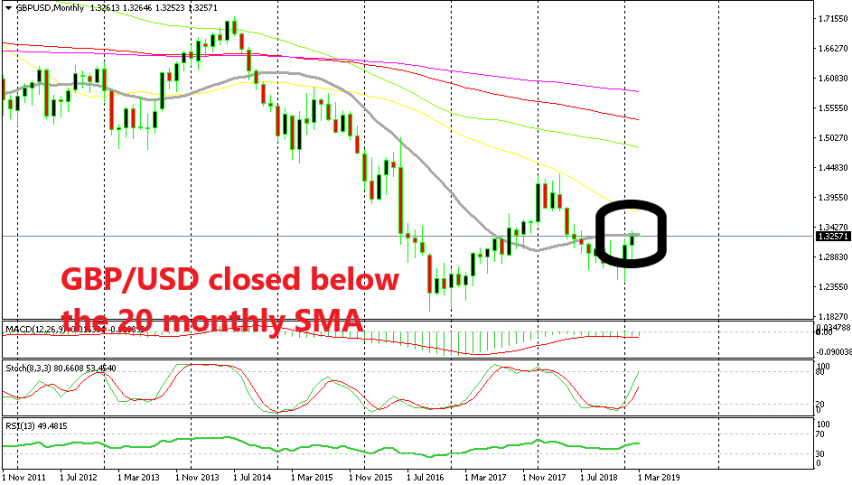
The GBP/USD has made quite an impressive reversal in the last two months. This pair had been in a bearish trend the entire year in 2018, but it formed a doji monthly candlestick in December which is a reversing signal. That candlestick was followed by two big bullish candlesticks and this pair finds itself trading nearly 10 cents higher from the lows in early January.
But, it now faces the 20 SMA (grey) on the monthly time-frame which stands close to the 1.33 level. The price pierced above this moving average on Wednesday pushing to 1.3350, but that still doesn’t count as a break until the candlestick closes above the 20 SMA.
Now, the 50 SMA is not the strongest indicator out there but it has provided support and resistance a few times before, so we should take it into consideration. The price closed at 1.3260 yesterday which was the last day of February.
Now it remains to be seen whether GBP/USD will continue to push higher and make a break or reverse down which would validate this moving average as a resistance indicator for now. The stochastic indicator is nearly overbought, so it wouldn’t be a surprise to see a decent pullback lower at least in the coming days.
- Check out our free forex signals
- Follow the top economic events on FX Leaders economic calendar
- Trade better, discover more Forex Trading Strategies
- Open a FREE Trading Account
- Read our latest reviews on: Avatrade, Exness, HFM and XM
Related Articles


Sidebar rates
Related Posts
