Ethereum Holds Above $2,500: Bulls Eye Critical $2,800 Breakout Level
Ethereum (ETH) is still above $2,500, and traders and analysts are paying attention to a key resistance level that might decide what the
Quick overview
- Ethereum is currently trading above $2,500, with a key resistance level at $2,800 that could determine its next move.
- Institutional demand for Ethereum ETFs has surged, with significant inflows indicating growing confidence from traditional finance.
- Technical analysis suggests that if Ethereum breaks the $2,800 resistance, it could see price targets ranging from $3,300 to $4,500.
- Traders should monitor support levels at $2,490 and $2,455, as a drop below these could lead to further declines.
Ethereum ETH/USD is still above $2,500, and traders and analysts are paying attention to a key resistance level that might decide what the cryptocurrency does next. ETH is currently trading at about $2,510. It has been quite strong since it hit its most recent top of $2,880 on June 11, which was a four-month high before the price drop.
ETH/USD Technical Analysis: Consolidation Below Key Resistance
Ethereum’s price reduction below the important $2,800 resistance barrier is being eagerly watched by market observers. Daan Crypto Trades, a well-known crypto expert, says, “Ethereum price action is compressing right below this big $2.8K level.” This means that a decisive break above this level might start a big upward trend.
The technical setup shows that ETH is currently stuck between two important moving averages: the 200-day simple moving average (SMA) at $2,600, which is functioning as resistance, and the 50-day SMA at $2,450, which is working as support. Historical data shows that when Bitcoin broke above its 200-day SMA in November 2024, it went up 40% from $3,130 to $4,100 by December 15, 2024.
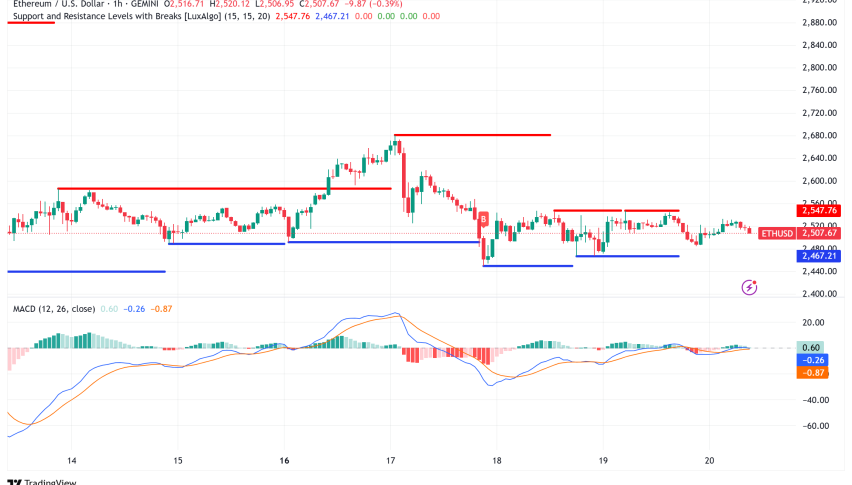
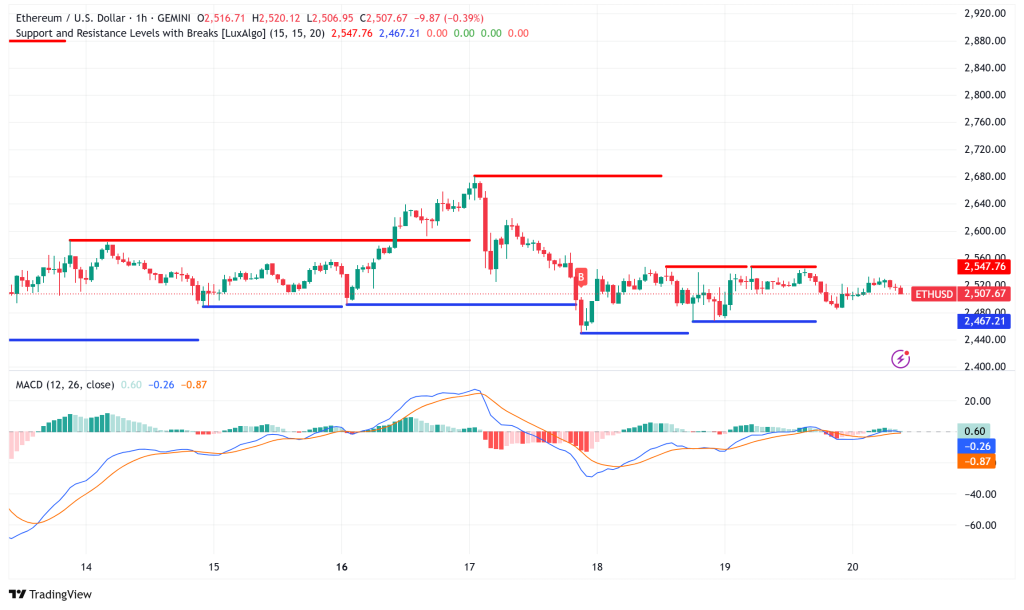
On the hourly chart, a rising channel has formed with support around $2,490. The first levels of resistance are at $2,540 and $2,565. The 50% Fibonacci retracement level from the most recent swing high to low is at $2,565. This is a big obstacle for bulls to get over.
Institutional Demand Drives Bullish Fundamentals
Spot Ethereum ETFs are still quite popular with institutions, with net inflows of $861.3 million in the last two weeks. After 19 days of steady inflows, these investment products bounced back with three days of new money, including more than $19 million on Wednesday alone. This is the greatest level of inflows since January, which shows that those who work in traditional finance are becoming more confident.
The staking ecosystem backs up the bullish story even more, with more than 500,000 ETH added to staking contracts between June 1 and the preceding Sunday. The total amount of ETH that has been staked has reached a new all-time high of more than 35 million tokens. This has effectively reduced the amount of ETH that is available for trading and could lead to scarcity.
Also, accumulation addresses—holders who have never sold—have hit record levels. They now own 22.8 million ETH, which is worth over $58 billion at current pricing. This number shows that long-term investors are very sure of themselves and there isn’t any selling pressure.
Price Targets Suggest Significant Upside Potential
If Ethereum breaks through the $2,800 resistance level, a number of technical patterns suggest that it might go up a lot. Analyst KlejdiCuni sees a bullish wave scenario with objectives of $3,300, $3,800, and finally $4,500, which is close to ETH’s all-time high of $4,878.
The daily charts show a bull flag pattern, which might lead to a breakout toward $3,900-$4,100. A cup-and-handle pattern, on the other hand, could lead to a 51% increase to $4,200. These technical forecasts are in line with fundamental strength indicators, such as the decreasing supply of liquid assets and the steady demand from institutions.
Ethereum Price Prediction
Traders should keep an eye on important support levels, even when the technical setup looks good. The first level of support is $2,490, while the second level is $2,455. If the price falls below these levels, it might keep going down to $2,360 or possibly $2,250.
The MACD indicator shows that momentum is slowing down in bearish territory on hourly timescales. However, the RSI has gone over the neutral 50 mark, which means that momentum may be picking up again. Analysts say that the $2,800 resistance level is still the most important point, and that it might cause a “violent move upward.”
Ethereum seems ready to break out over $3,000 in the next few weeks, based on current technical analysis and fundamental reasons. If the $2,800 resistance level is firmly broken and held as support, the possible goals are between $3,300 and $4,100.
- Check out our free forex signals
- Follow the top economic events on FX Leaders economic calendar
- Trade better, discover more Forex Trading Strategies
- Open a FREE Trading Account
- Read our latest reviews on: Avatrade, Exness, HFM and XM
Related Articles


Sidebar rates
Related Posts
