Silver has experienced a dramatic 39% decline in just one week after a significant 945% rally from Covid-era lows.
Despite the recent pullback, silver's long-term trend remains bullish, supported by a golden crossover in exponential moving averages.
Current technical indicators show weakening momentum, with bearish signals emerging in the MACD and RSI.
Silver is finding support around key Fibonacci levels, with potential for a relief bounce towards the 50-period 4H EMA.
After a parabolic 945% rally from Covid-era lows, silver has abruptly reversed—plunging 39% in just one week. The key question now is whether this move represents a healthy correction—or the beginning of a deeper downside.
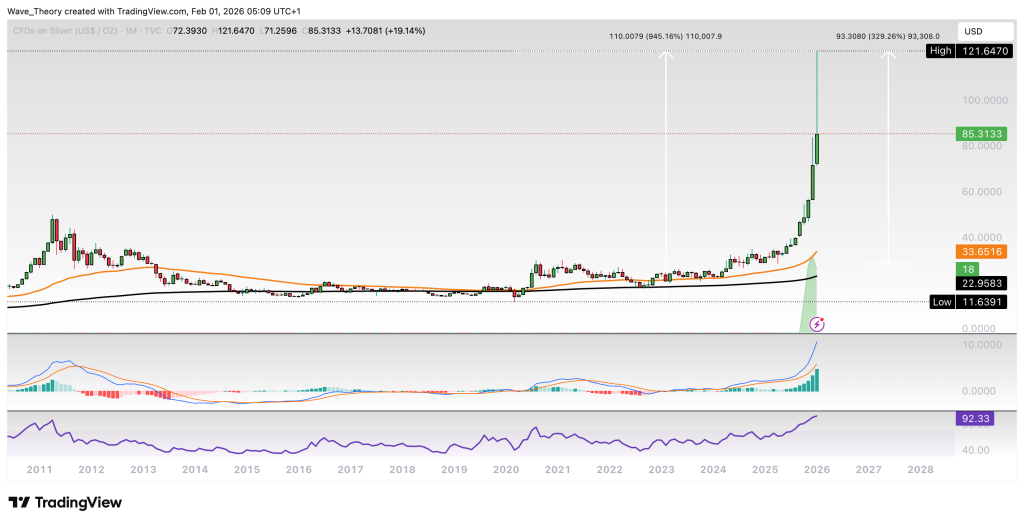
Silver Price Enters a Parabolic Expansion Phase on the Multi-Year Timeframe
Silver remains structurally extremely bullish on the monthly timeframe. Momentum confirms the strength of the trend, with the RSI firmly embedded in overbought territory, bullishly crossed MACD lines, and a MACD histogram that continues to expand to the upside. Since April alone, silver has surged approximately 329%, culminating in a new all-time high at $121.65, underscoring the parabolic nature of the advance rather than a gradual trend progression. In addition, the exponential moving averages have completed a golden crossover, providing further confirmation that the long-term trend remains firmly bullish.
SILVER
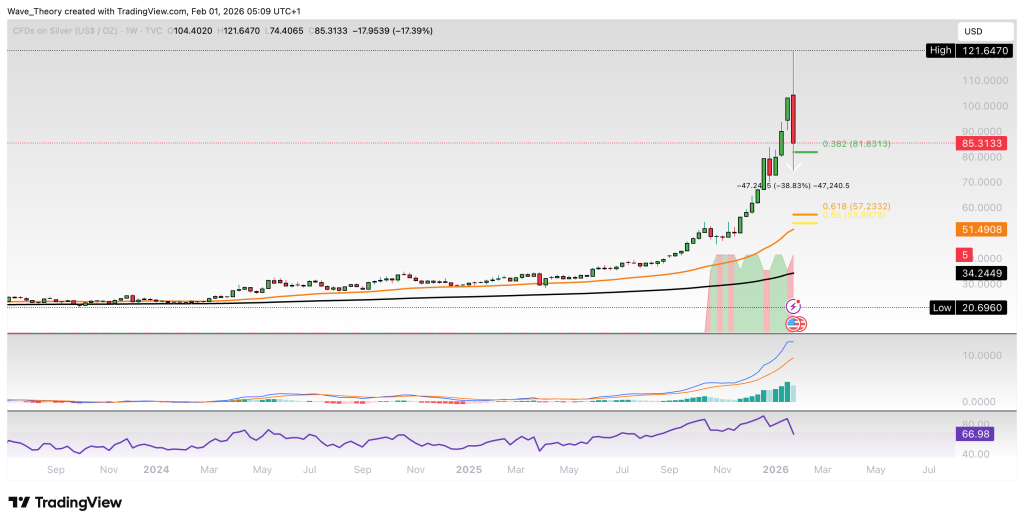
Silver Price Drops 39% in a Single Week as Momentum Cools Sharply
On the weekly chart, the MACD lines remain bullishly crossed, although the MACD histogram has started to tick bearishly lower, signaling a loss of upside momentum. The EMAs continue to display a golden crossover, confirming that the mid-term trend remains bullish despite the sharp pullback. However, the RSI has printed a bearish divergence, which has already materialized in a 39% weekly decline. For now, silver is finding notable Fibonacci support around $82, with the next major support level located near $57.
SILVER
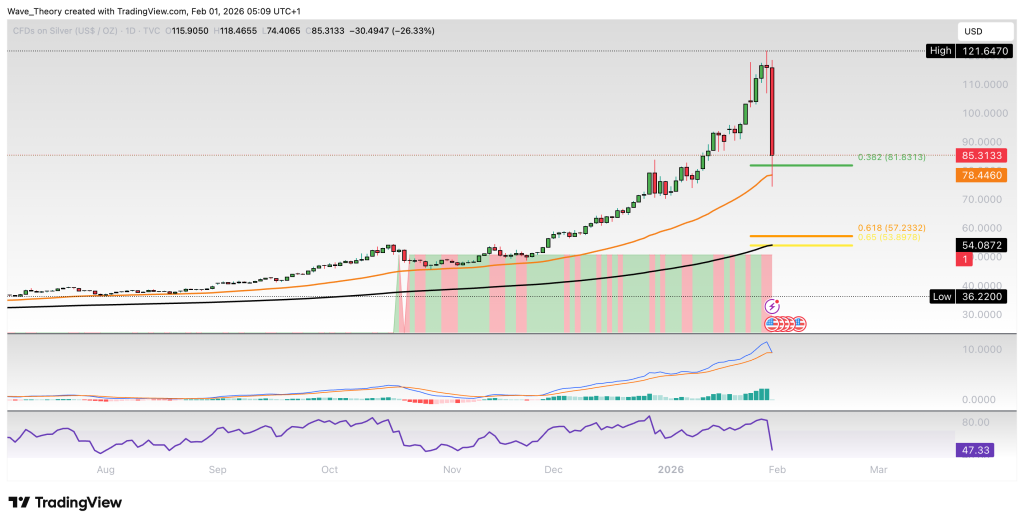
Silver Plunges 37% in a Single Session as Short-Term Momentum Deteriorates
Friday alone, silver has pulled back sharply by 37%. Price is currently finding support at the 0.382 Fibonacci retracement near $51, while the 50-day EMA at $78.5 provides overhead technical relevance. In addition, the 200-day EMA around $54 aligns with the golden ratio, reinforcing this zone as a critical area of support. Despite the aggressive sell-off, the EMAs on the daily chart still display a golden crossover, confirming the short- to medium-term trend as bullish. However, momentum is weakening: the MACD lines are on the verge of a bearish crossover, and the MACD histogram has begun to tick bearishly lower on Friday, signaling rising downside pressure in the near term.
SILVER
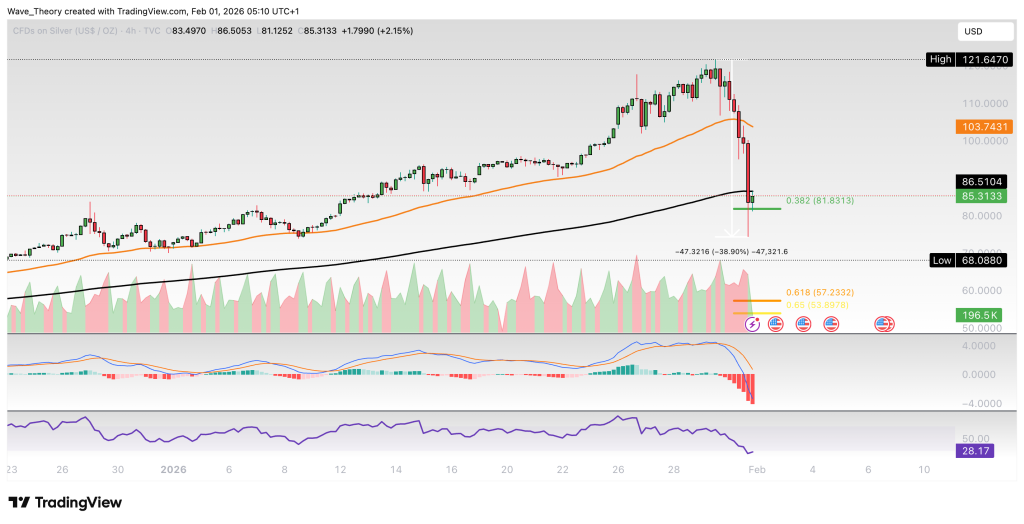
Silver May Attempt a Relief Bounce Toward the 50-4H EMA Near $103.74
On the 4-hour chart, the EMAs continue to display a golden crossover, confirming that the short-term trend remains bullish despite recent weakness. However, momentum is still under pressure, with the MACD lines bearishly crossed and the MACD histogram ticking bearishly lower, while the RSI has now reached oversold territory. From a technical perspective, silver could bounce from the 0.382 Fibonacci support around $81, potentially initiating a relief move toward the 50-period 4H EMA at $103.74
SILVER
Summary & Key Levels
Silver has undergone a violent correction, dropping 39% on the week and 37% in a single session after a multi-year 945% parabolic rally, yet the broader trend structure remains bullish across higher timeframes. While momentum has clearly weakened—evidenced by bearish divergences and fading MACD signals—multiple Fibonacci and EMA confluences suggest the current move may still be corrective rather than trend-breaking.
Major support: $54–$57 zone (200-day EMA, golden ratio, weekly Fib)
Short-term risk level: $51 (daily 0.382 Fib)
A sustained hold above the $54–$57 region would favor a stabilization and potential relief bounce, while a decisive breakdown below this zone would materially increase downside risk.
Konstantin Kaiser comes from a data science background and has significant experience in quantitative trading. His interest in technology took a notable turn in 2013 when he discovered Bitcoin and was instantly intrigued by the potential of this disruptive technology.