Sandisk Stock Goes Parabolic: Is There More Upside to Come?

Sandisk

Quick overview

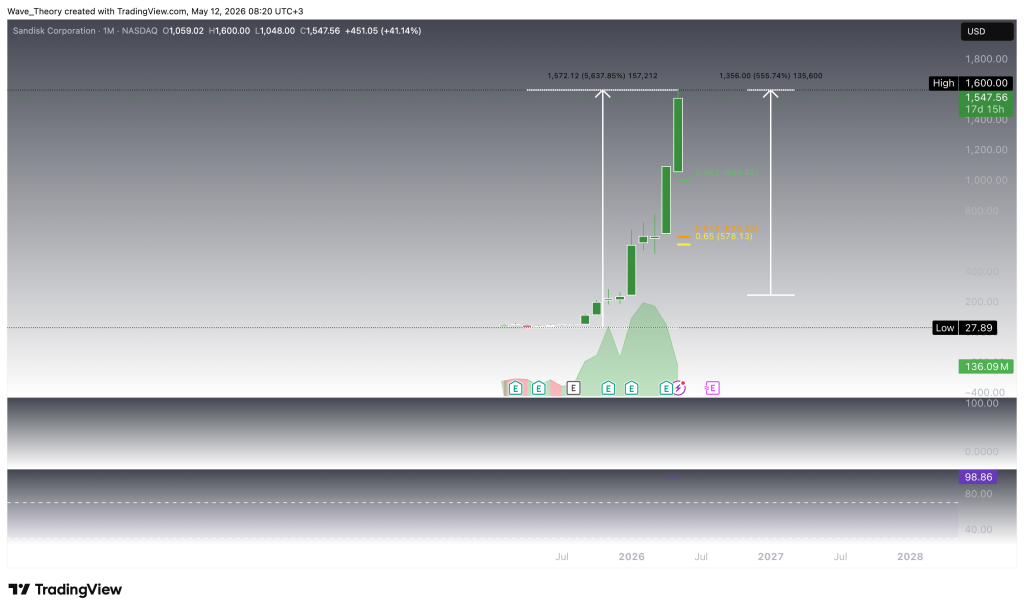
  • Sandisk stock (SNDK) has surged over 5,638% recently, with a 556% gain year-to-date, driven by high demand for AI-related memory solutions.
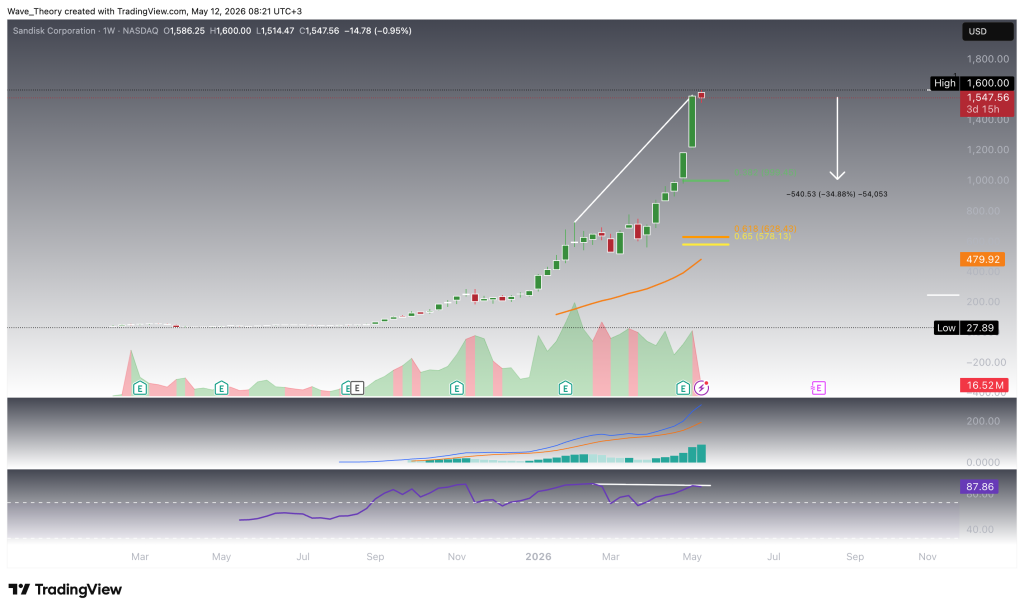
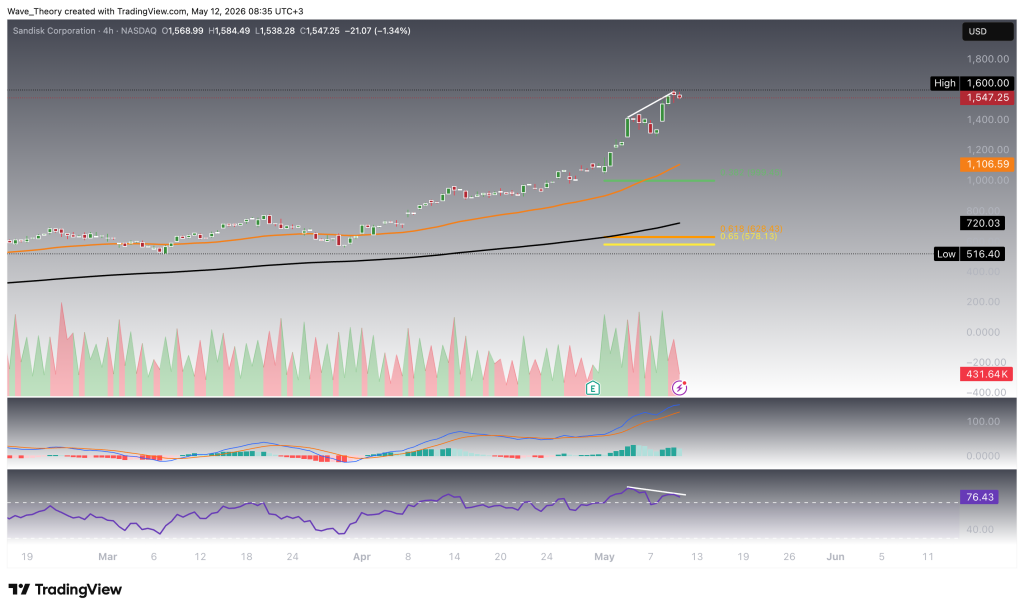
  • The stock reached an all-time high of $1,600, reflecting strong market momentum despite emerging bearish divergences on multiple timeframes.
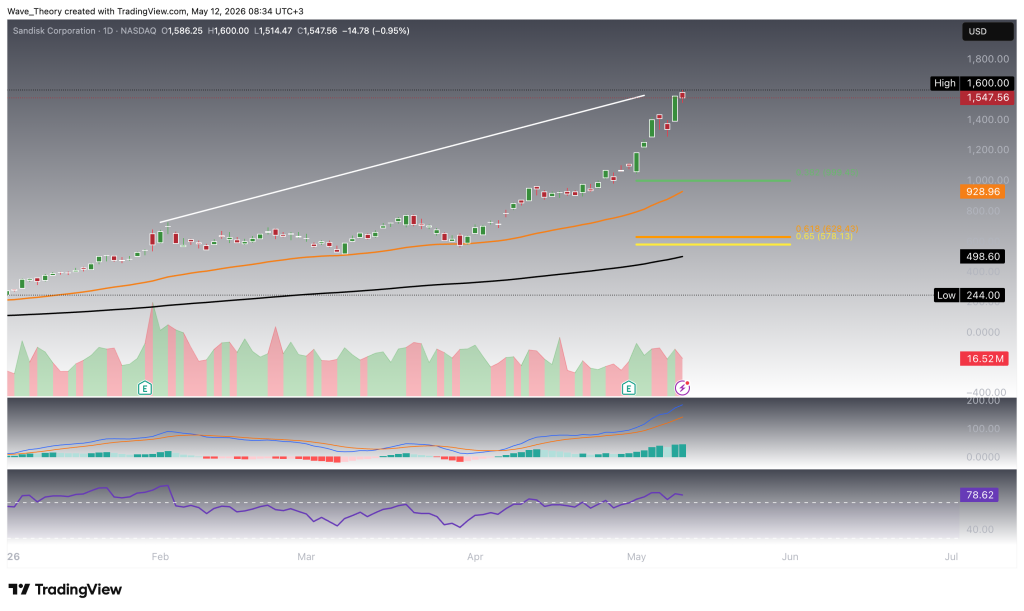
  • Technical indicators show a mix of bullish signals and signs of weakening momentum, suggesting a potential corrective phase could be on the horizon.
  • Key support levels to watch are at $1,000, $929, and $600, with a break below $1,000 potentially accelerating downside pressure.

Sandisk stock (SNDK) has skyrocketed by more than 5,638% over the past several months, including a stunning 556% year-to-date gain, as investors pile into the flash memory giant amid booming AI-driven demand and bullish momentum.

Sandisk Stock (SNDK) Reaches $1,600

Sandisk stock extended its exceptional multi-month rally to a fresh all-time high at $1,600, reflecting one of the strongest momentum advances in the market this year, with shares now up roughly 556% year-to-date. The move has been primarily driven by surging demand for high-speed memory and storage solutions required to train and run artificial intelligence models at scale. As a manufacturer of NAND flash and SSD-related products, Sandisk remains directly positioned to benefit from this structural AI tailwind. In addition, multiple industry reports continue to highlight robust AI-driven demand alongside ongoing supply shortages, a backdrop that has materially strengthened pricing power, earnings expectations, and the broader bullish re-rating of the stock.

Sandisk
Sandisk

Massive Bearish Divergence Emerges on the Weekly Chart

On the weekly timeframe, Sandisk has developed a pronounced bearish divergence, a technical warning signal that may indicate fading upside momentum and the potential onset of a broader corrective phase. Should the stock transition into a major pullback, the next significant support zones are located near $1,000 and $600, representing potential downside of roughly 35% from current levels. Below that, the 50-month EMA stands as a major long-term dynamic support level near $480. Despite the emerging bearish divergence, momentum indicators have not fully rolled over yet, as the MACD lines remain in a bullish crossover configuration while the MACD histogram has continued to print higher readings over recent weeks, highlighting an ongoing tension between weakening price momentum and still-constructive trend signals.

Sandisk
Sandisk

Predominantly Bullish Signals Persist on the Daily Chart

On the daily timeframe, Sandisk continues to display predominantly bullish technical signals despite its extended advance. The MACD lines remain in a bullish crossover structure, while the MACD histogram has turned higher since yesterday, indicating renewed positive momentum in the near term. In addition, the EMA structure maintains a golden crossover, confirming the prevailing uptrend across the short- to medium-term horizon. Simultaneously, the RSI remains in overbought territory, reflecting strong momentum but also signaling increasingly stretched conditions. Moreover, it shows a bearish divergence. Should Sandisk enter a major corrective phase, the 50-day and 200-day EMAs represent significant dynamic support levels near $929 and $499, respectively.

Sandisk
Sandisk

Bearish Divergence Forms on the 4H RSI

On the 4-hour chart, the RSI has also developed a bearish divergence, potentially signaling weakening momentum and raising the probability of a sharper pullback toward the next Fibonacci support levels. In addition, while the RSI remains in overbought territory, the MACD histogram has begun to tick lower, indicating early signs of bearish momentum building beneath the surface. However, trend confirmation remains constructive for now, as the MACD lines continue to hold a bullish crossover while the EMA structure maintains a golden crossover, reinforcing the short-term bullish trend despite emerging corrective risks.

Sandisk
Sandisk

Sandisk Stock Outlook: Bullish Trend Faces Rising Correction Risk

Sandisk remains in a powerful long-term uptrend, supported by bullish MACD and EMA structures across the daily and 4H timeframes, while the stock continues to trade near fresh all-time highs after its parabolic advance. However, pronounced bearish divergences on the weekly, daily and 4H RSI suggest upside momentum is fading and the probability of a broader corrective move is increasing. Immediate downside support levels are located at $1,000, followed by $929 at the 50-day EMA, then $600. Below that, major long-term support rests near $499 at the 200-day EMA and $480 at the 50-month EMA. As long as Sandisk holds above $1,000, the broader bullish structure remains intact, but a break below that level could accelerate downside pressure toward the deeper support zones.

ABOUT THE AUTHOR See More
Konstantin Kaiser
Financial Writer and Market Analyst
Konstantin Kaiser comes from a data science background and has significant experience in quantitative trading. His interest in technology took a notable turn in 2013 when he discovered Bitcoin and was instantly intrigued by the potential of this disruptive technology.

Related Articles

HFM

HFM rest

Pu Prime

XM

Best Forex Brokers