XRP Price Forecast: Will Triangle Breakouts Push XRP Price Levels Past $1.36?
XRP is currently in a very compressed technical pattern, priced at $1.3475 following a slight 0.66% recovery on a localized intraday...
Quick overview
- XRP is currently priced at $1.3475 and is forming a symmetrical triangle pattern, indicating a potential for increased volatility.
- The bipartisan CLARITY Act has passed a key Senate committee vote, which could provide regulatory clarity and support for XRP as a commodity.
- On-chain data shows a decline in XRP liquidity on major exchanges, suggesting that price movements may become more pronounced with large market orders.
- Traders are advised to prepare for potential price action as XRP approaches key resistance levels, with a bullish breakout possible following the Senate vote.
XRP is currently in a very compressed technical pattern, priced at $1.3475 following a slight 0.66% recovery on a localized intraday chart. The cryptocurrency is trapped within a converging compression on its two-hour time frame as it forms a narrow symmetrical triangle pattern. The compression near the triangle apex represents the standoff between a growing regulatory shield for institutional buyers and the narrowing of order book liquidity in the secondary exchange market.
Today’s Major Catalysts
Bipartisan CLARITY Act Progress: The Digital Asset Market Clarity Act provides a significant fundamental tailwind for XRP after passing its markup in the Senate Banking Committee by a vote of 15-9 in a bipartisan agreement. The proposed law would bring greater clarity to jurisdictional rules within the digital assets market. This legislation would specifically designate the major non-securities tokens as commodities under federal law.
Narrowing Exchange Liquidity: New on-chain data indicates a significant decline in XRP liquidity and order book depth on major exchanges, such as Binance. This means that a thin order book is increasingly likely to move prices when large market participants engage in aggressive market orders.
Increased ETF Asset AUM: Wall Street continues to show strong appetite for compliant asset classes. The total cumulative net inflows into spot XRP ETFs are on track to exceed $1.5 billion in net new capital, which will increasingly restrict supply available in public order books.
Technical Overview
The two-hour chart features a perfect classical symmetrical triangle consolidation. XRP is currently coiled between the white ascending support line, which is formed by the multi-week $1.3058 lows of 10 and a prominent red resistance trendline established by the recent $1.4100 local lower highs.
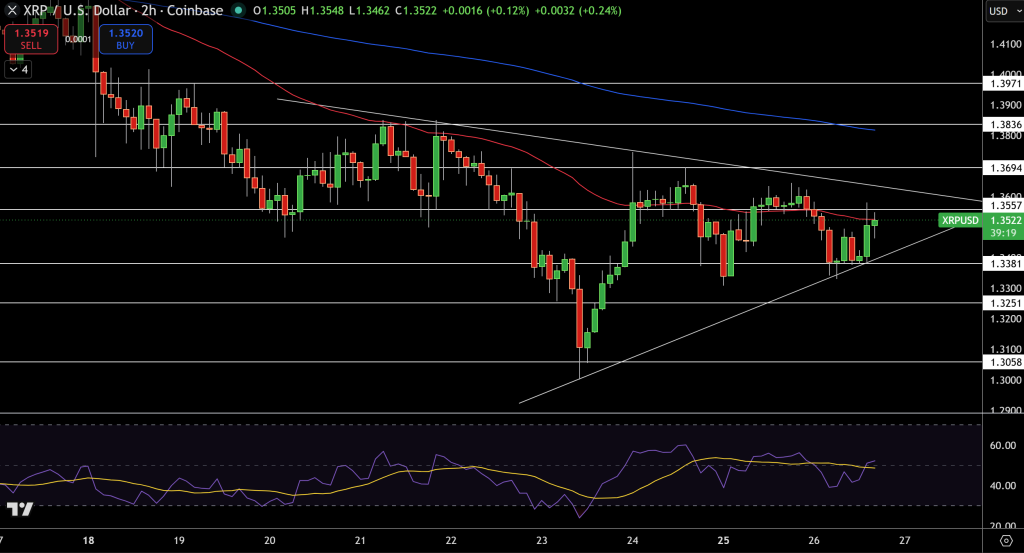
Price action is moving within a downward sloping blue trendline that introduces additional layering of resistance at a price level of $1.3694. The 14-period RSI is currently holding steady at the neutral 50 mark, suggesting neutral price momentum. Due to the presence of a tight horizontal support price level at $1.3381 and price action being near a descending trendline, a strong directional impulse from either an upside or downside is likely.
Resistance: $1.3557, $1.3694 (Resistance Triangle Top), and $1.3836 (Major Dynamic Resistance Level). Support: $1.3381 (Immediate Swing Support Level), $1.3200, and $1.3058 (Multi-week Support Level).
Trading Strategy
A strong directional catalyst is likely to develop an exit strategy if price closes above this immediate structural resistance.
Buy Order: Enter a long Buy Stop order when the 2-hour candle closes above $1.3557. Targets: Take partial profits at $1.3694 (T1) and $1.3836 (T2). Stop Loss: Place a stop loss below the key structural support level at $1.3381.
Summary
In our short-term technical price analysis on XRP, it appears the token is undergoing a significant range contraction and is likely to see increased volatility in the near term. However, while monetary policy will keep the entire digital asset ecosystem under intense pressure from the macroeconomic environment, XRP’s unique combination of institutional adoption prospects and clear legal compliance will serve as a strong support. Traders may choose to take advantage of these tight channel boundaries to prepare for the expected full Senate vote on the CLARITY Act, as a strong bullish breakout may lead to a renewed push toward higher price levels in the medium-to-long term.
- Check out our free forex signals
- Follow the top economic events on FX Leaders economic calendar
- Trade better, discover more Forex Trading Strategies
- Open a FREE Trading Account
- Read our latest reviews on: Avatrade, Exness, HFM and XM

Related Articles



Sidebar rates

Related Posts
 Save
Save