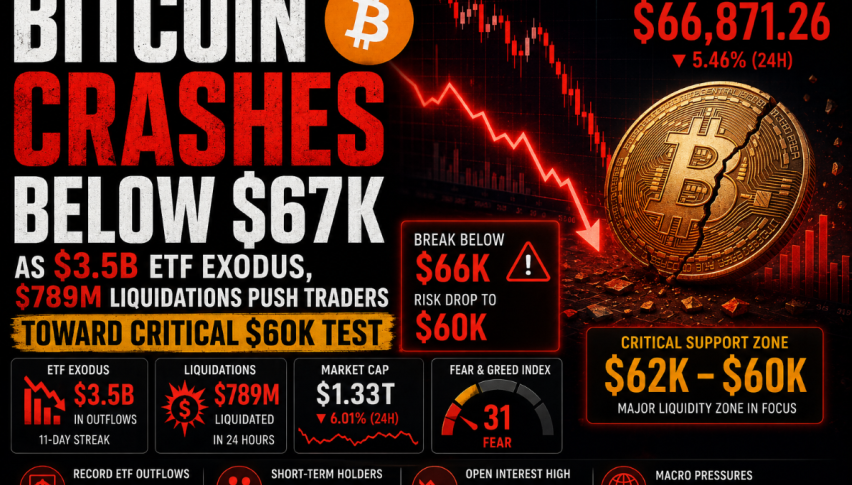
Bitcoin Crashes Below $67K as $3.5B ETF Exodus, $789M Liquidations Push Traders Toward Critical $60K Test
Bitcoin price falls below $67,000 as ETF outflows hit $3.5 billion, liquidations near $800 million. Traders eye key support around $60,000.
Written by:
Arslan Ali Butt•Wednesday, June 3, 2026•4 min read
•Last updated: Wednesday, June 3, 2026
Quick overview
Bitcoin experienced its largest selloff in months, dropping below $67,000 due to record ETF outflows and weakening institutional demand.
Approximately $2.8 billion to $3.5 billion in cumulative ETF outflows have occurred, marking the longest withdrawal streak since 2024.
Market sentiment worsened after Strategy's minor Bitcoin sale, leading to increased selling pressure and a derivatives-driven liquidation event.
Bitcoin is now approaching critical support levels, with the $60,000 mark being pivotal for its future market trajectory.
Bitcoin suffered its sharpest selloff in months on Tuesday, plunging below $67,000 as a combination of record ETF outflows, aggressive long liquidations, weakening institutional demand, and deteriorating market sentiment triggered a broad crypto market rout.
The world’s largest cryptocurrency fell more than 6% over the past 24 hours to around $66,800, wiping out billions of dollars in market value and dragging the broader crypto market lower. Bitcoin futures volume surged above $125 billion while open interest remained elevated near $52 billion, underscoring the scale of the ongoing deleveraging event.
The decline comes as investors increasingly rotate capital toward AI-related equities while concerns over geopolitical tensions, rising bond yields, and weakening ETF demand continue weighing on crypto markets.
Record Bitcoin ETF Outflows Become a Major Headwind
One of the biggest drivers behind Bitcoin’s recent weakness has been an unprecedented wave of ETF redemptions.
U.S. spot Bitcoin ETFs have now recorded approximately 10 to 11 consecutive trading days of net outflows, the longest withdrawal streak since the products launched in 2024.
Key flow metrics include:
Roughly $2.8 billion to $3.5 billion in cumulative ETF outflows
ETF assets under management falling from more than $104 billion to around $94 billion
The outflows suggest institutional investors are reducing Bitcoin exposure amid a broader risk-off environment.
Some market participants appear to be rotating capital into AI stocks, while others are selectively moving into alternative crypto themes such as Solana, XRP, and newer ETF products.
The trend has significantly weakened one of Bitcoin’s strongest bullish narratives for 2026: sustained institutional demand through ETFs.
Strategy’s Bitcoin Sale Shocks the Market
Sentiment also deteriorated after Strategy, formerly known as MicroStrategy, disclosed a small Bitcoin sale.
While the transaction itself was relatively minor, the symbolic impact proved much larger.
For years, Executive Chairman Michael Saylor had promoted a “never sell Bitcoin” philosophy. The decision to sell even a small portion of holdings created uncertainty among investors and contributed to growing nervousness across the market.
The news accelerated selling pressure and added fuel to an already fragile market structure.
BTC Liquidation Cascade Magnifies Downside
The sharp decline quickly evolved into a derivatives-driven liquidation event.
According to market data:
More than $789 million in Bitcoin long positions were liquidated within 24 hours.
Funding rates remain positive around 0.08%, indicating bullish positioning has not fully reset.
The persistence of positive funding rates despite falling prices suggests leverage remains elevated, leaving the market vulnerable to additional liquidations if support levels fail.
This dynamic has transformed what began as a correction into a deeper deleveraging event.
On-Chain Data Signals Capitulation
Blockchain data increasingly points toward panic selling among recent buyers.
According to CryptoQuant data, short-term holders are now realizing losses at the fastest pace since early February.
Several notable signals have emerged:
Short-term holder losses on Binance reached their worst level since February.
Exchange inflows from mid-sized investors climbed to the highest level in nearly four months.
Binance retail inflows surged to approximately $9.2 billion, the highest level since November 2025.
Recent buyers are increasingly exiting positions at a loss.
Historically, such capitulation events often occur near local bottoms. However, they can also persist longer than expected during periods of sustained market stress.
The key question now is whether incoming demand can absorb the growing supply reaching exchanges.
Why is Bitcoin price down today?
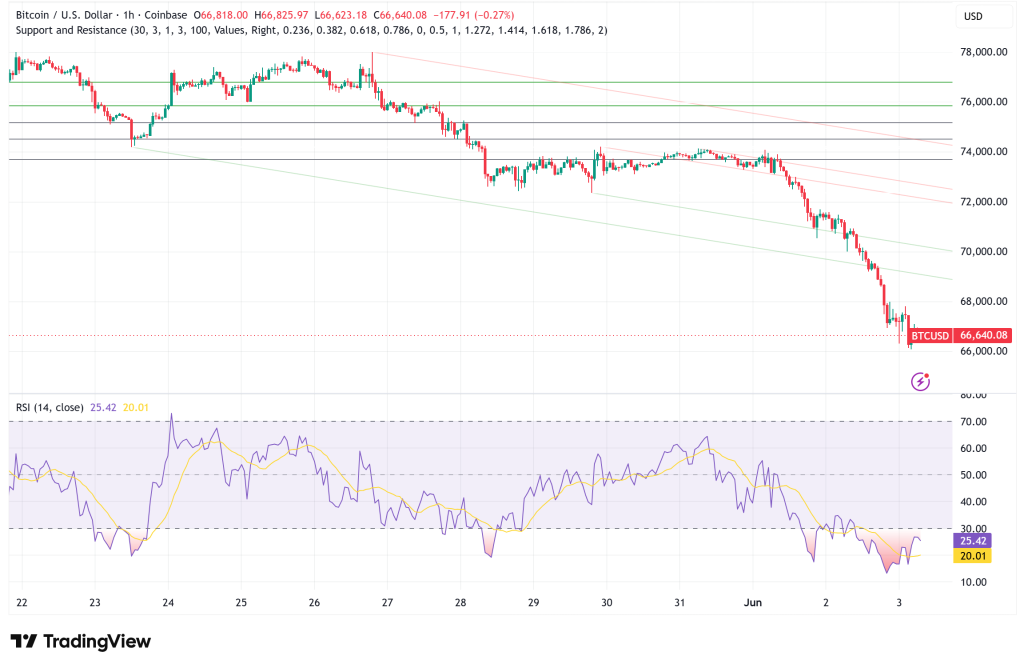
BTC Technical Analysis: Bitcoin Approaches a Critical Support Zone
Bitcoin’s technical structure has deteriorated significantly over the past week.
The breakdown below several major support levels has shifted momentum firmly toward sellers.
Key Technical Signals
BTC lost support at $74,800 and $70,400.
Price has fallen below $67,000 for the first time since April.
The 8-hour RSI dropped near 30, reaching its lowest reading since February.
Futures liquidations reached the highest level in four months.
Open interest remains elevated despite the decline.
The combination suggests the market remains under pressure, although oversold conditions are beginning to emerge.
RSI and Market Positioning
The RSI near 29-30 indicates deeply oversold conditions, reflecting extreme selling pressure and forced liquidations. While oversold readings often precede relief rallies, they do not guarantee a reversal, especially when ETF outflows and institutional selling remain active.
Liquidity Zones and Support Levels
Several major support zones are now attracting trader attention:
Level Type
Approximate Area
Immediate Resistance
$68,900
Major Resistance
$70,400
Trend Recovery Level
$75,000
Near-Term Support
$66,100-$66,500
Major Liquidity Zone
$62,300-$65,600
Critical Support
$60,000
Bearish Pattern Target
$56,000
The area between $62,300 and $65,600 represents the next significant liquidity pocket.
Many traders view the broader $60,000 zone as the most important support level in the current cycle.
Veteran trader Peter Brandt recently highlighted an expanding triangle pattern that projects a downside target near $56,000 if current support levels fail.
Macro Environment Remains Challenging
Bitcoin is also facing pressure from broader macroeconomic conditions.
Several factors continue weighing on risk assets:
Rising Treasury yields
Elevated real interest rates
U.S.-Iran geopolitical tensions
Strength in AI-related equities
Tight financial conditions
Reduced risk appetite among institutions
Historically, Bitcoin has performed best when real interest rates decline.
At present, real rates remain restrictive, limiting liquidity and reducing the attractiveness of speculative assets.
Long-Term Bull Case Remains Intact
Despite near-term weakness, several long-term Bitcoin models remain constructive.
Bitwise recently highlighted growing sovereign debt risks as a potential catalyst for future Bitcoin demand.
The firm noted:
Governments and corporations may borrow roughly $29 trillion during 2026.
Japan’s debt-to-GDP ratio remains near 230%.
Sovereign bond markets are showing signs of stress.
Global refinancing needs continue rising.
Using investor Greg Foss’s sovereign default-risk framework, Bitwise estimated a theoretical Bitcoin fair value near $224,000 if adoption as a sovereign-risk hedge expands significantly.
Separately, analysts using the Bitcoin Decay Channel model continue projecting potential cycle targets between $90,000 and $255,000 by the end of 2026.
Importantly, both estimates represent valuation frameworks rather than direct price forecasts.
Outlook: Can Bitcoin Defend $60K?
The market now faces a critical test.
Short-term sentiment has deteriorated sharply. ETF demand has reversed. Leverage remains elevated. Retail investors are capitulating. Institutional flows are weakening.
Yet Bitcoin is simultaneously approaching some of its most important support zones of the year.
The next few weeks will likely hinge on three factors:
Whether ETF outflows begin stabilizing.
Whether buyers defend the $60,000-$65,000 support region.
Whether macro conditions become more favorable for risk assets.
If support holds and ETF flows improve, the current selloff could eventually resemble previous capitulation events that marked local bottoms.
If not, Bitcoin may face its most significant correction since the first quarter of 2026.
For now, traders remain focused on one key level: $60,000. It may determine whether Bitcoin’s bull market merely pauses—or enters a much deeper reset.
Lead Markets Analyst – Multi-Asset (FX, Commodities, Crypto)
Arslan Ali Butt serves as the Lead Commodities and Indices Analyst, bringing a wealth of expertise to the field. With an MBA in Behavioral Finance and active progress towards a Ph.D., Arslan possesses a deep understanding of market dynamics.
His professional journey includes a significant role as a senior analyst at a leading brokerage firm, complementing his extensive experience as a market analyst and day trader. Adept in educating others, Arslan has a commendable track record as an instructor and public speaker.
His incisive analyses, particularly within the realms of cryptocurrency and forex markets, are showcased across esteemed financial publications such as ForexCrunch, InsideBitcoins, and EconomyWatch, solidifying his reputation in the financial community.