Gold Price Forecast — July 22, 2026: $4,130 Breakout Targets $4,185–$4,246 Ahead of ECB and FOMC
As of July 22, XAU/USD is trading at $4,133. This move has pushed the price above its descending trendline and completed a triple-bottom...

Quick overview
- As of July 22, XAU/USD is trading at $4,133, having completed a triple-bottom formation at $3,964 and breaking above a descending trendline.
- Gold has risen 4.8% since its low of $3,941 on July 9, with key upcoming events including the ECB meeting and the FOMC meeting that could influence its price.
- Central banks continue to support the gold market, with net purchases of 244 metric tonnes reported in Q1 2026, indicating strong base demand.
- The technical outlook suggests that a breakout above $4,138 could lead to targets of $4,185 to $4,246, with critical support levels identified.
As of July 22, XAU/USD is trading at $4,133. This move has pushed the price above its descending trendline and completed a triple-bottom formation at $3,964, a low it has revisited three times. Since its seven-month trough of $3,941 on July 9, gold is up 4.8%. Key upcoming events include the ECB this Thursday and the FOMC meeting on July 28 to 29. While both could drive the price, they carry opposing implications: a hawkish ECB stance would strengthen the dollar and potentially restrain gold, whereas dovish rhetoric from the FOMC suggesting a “hold” on rates could reignite speculation of rate cuts and propel the gold breakout further.
The Triple Bottom That Changed the Technical Structure
Gold rallied from $3,941, its lowest point since July 9, a level previously tested three times since late June, breaking firmly through the descending trendline and reclaiming the 50-period EMA at $4,049. This confirmed triple-bottom setup represents the most substantial technical breakthrough in gold since the metal’s February all-time high of $5,400 triggered a prolonged correction.
Fundamentally, the rally aligns with recent US economic data indicating a slow-down in the labor market following improvement earlier in the year. Consequently, expectations for an imminent Federal Reserve rate hike have dissipated.
- The four-week average for the ADP Employment Change has softened to 21,000 from 24,250, while June Non-Farm Payrolls (NFP) came in at a modest 57,000 versus an expected 110,000.
- These prints shifted the probability of a September Fed hike down from 67% to roughly 50%, offering the first real monetary policy relief for gold since May.
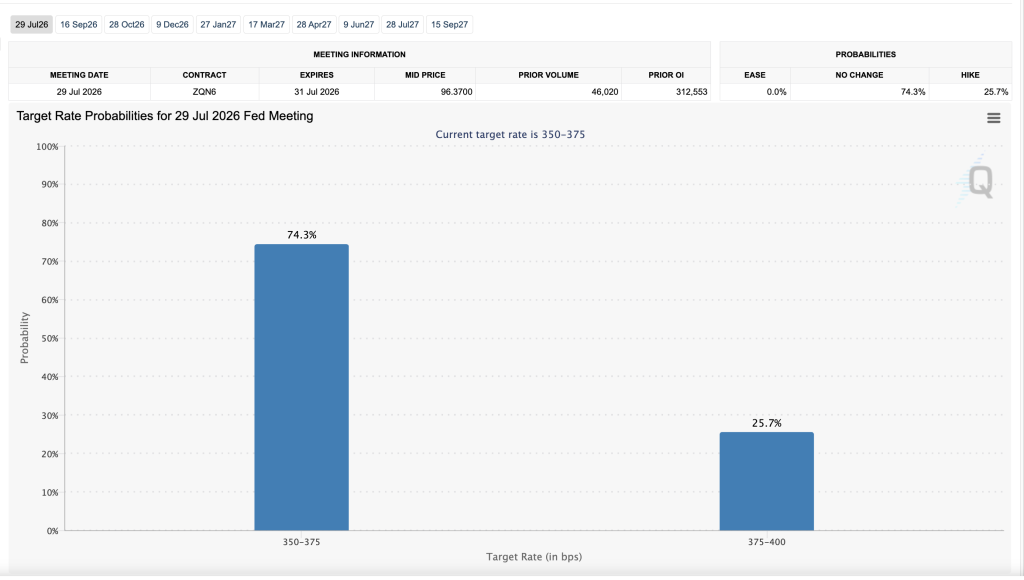
CME Group projects nearly 74% probability that the Fed will maintain interest rates in the 3.50 to 3.75% range for July. Given that a rate hold is almost certain by next week, gold’s short-term trajectory now hinges on Federal Reserve Chair Warsh adopting a more dovish tone than the hawkish rhetoric that has weighed on the market all year, alongside the outcome of the ECB meeting on Thursday.
Meanwhile, central bank buying continues to underpin the market. The World Gold Council reports that central banks were net buyers of 244 metric tonnes in the first quarter of 2026. Significant purchasers listed in the sector included Poland, China, Turkey, the Czech Republic, and Kazakhstan. Distinct from ETF investors, central banks acquire gold to diversify their currency reserves, ensuring consistent base demand independent of short-term fluctuations in the interest rate environment.
Gold (XAU/USD) Technical Outlook: $4,138 Is The Key To $4,185 to $4,246
The 4-hour chart clearly shows a breakout above the descending trendline and a reclamation of the 50-period EMA at $4,049. The $3,964 zone is now verified as a major support level.
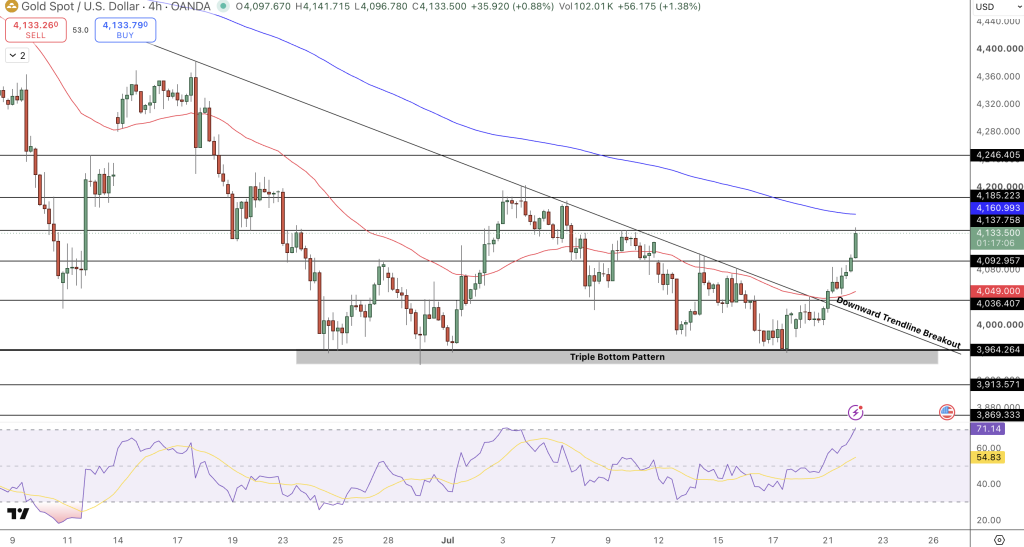
- Resistance: $4,137.76 (current resistance; a move above here opens the door to higher targets) → $4,185.22 → $4,246.41 (the 100-period EMA).
- Support: $4,092.96 (former resistance now support) → $4,049 (50 EMA; buyers must defend this level to prevent a trend reversal) → $3,964 (triple-bottom support).
The Relative Strength Index (RSI) has breached 71, signaling strong bullish momentum. While an RSI above 70 can sometimes indicate overbought conditions, strong breakouts often maintain elevated RSI readings for significant durations without indicating exhaustion. This reading does not signal a reversal in the context of a fresh bullish setup.
Gold ($XAUUSD) Technical Outlook
Gold has broken above its descending trendline and reclaimed the 50 EMA, confirming a bullish breakout from the recent triple-bottom pattern.
📈 Resistance:
• $4,137
• $4,185
• $4,246
📉 Support:
• $4,093
• $4,049#Gold #XAUUSD #PreciousMetal pic.twitter.com/guepDjArj7— Arslan Ali (@forex_arslan) July 22, 2026
In my opinion, the idea is to go long on a breakout above $4,138 | Target: $4,185 to $4,246 | Stop-loss below $4,093.
Event calendar for this week:
- ECB (Thursday), consensus expects a rate hold at 2.25%, with a primary focus on Christine Lagarde’s comments regarding a potential September rate increase.
- PMI data (Thursday/Friday)
- Weekly Initial Jobless Claims (Thursday)
- FOMC (July 28 to 29), consensus expects another hold (85.6% probability), with market focus on Warsh’s commentary.
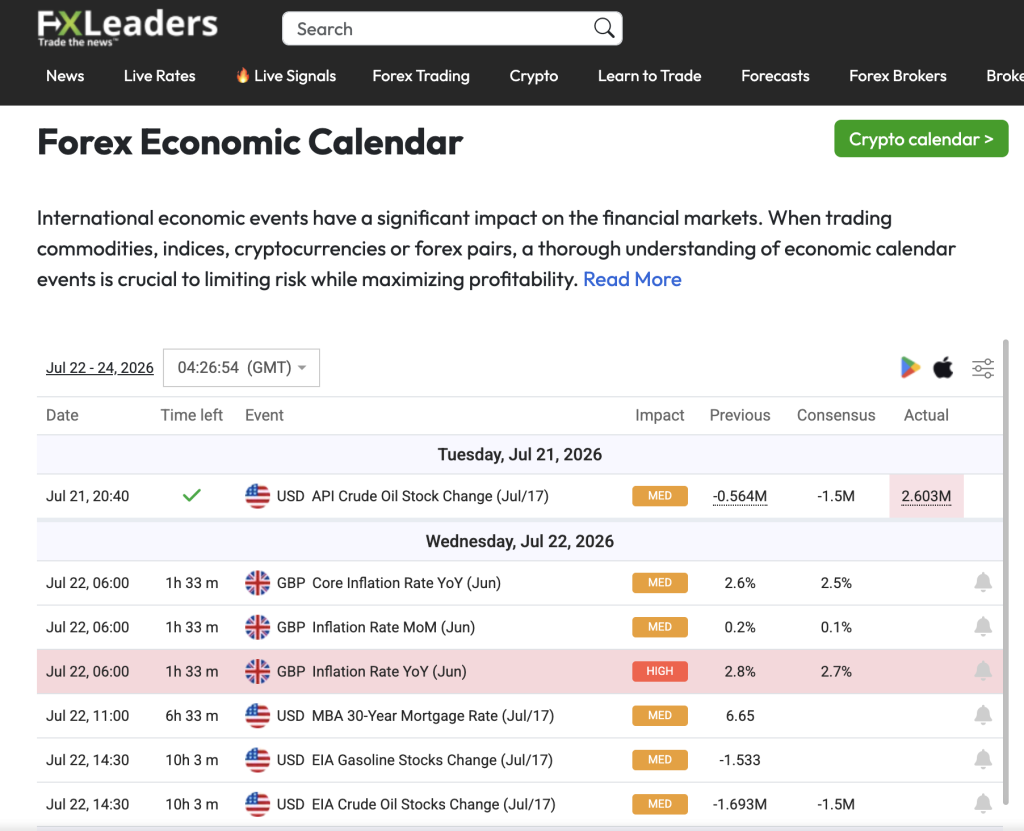
Checkout FXLeaders economic calendar for more details.
FAQ: Gold — Triple Bottom, ECB/FOMC Catalysts, and the $4,246 Target
What is the gold triple-bottom pattern and why does it matter?
A triple-bottom is a chart pattern formed when a security tests the same price support level three times before rising, indicating that sellers cannot push the price below that floor. Gold’s current price tested $3,964 in late June, early July, and again in mid-July before breaking out.
After successfully defending the support level on three separate occasions, followed by a breach of the descending trendline and the 50-period EMA, the price action represents one of the highest-probability bullish reversals in technical trading.
The confirmation indicates that sellers have reached capacity at $3,964, and the path of least resistance is now to the upside.
What does the ECB meeting on Thursday mean for gold?
The European Central Bank is expected to maintain the deposit rate at 2.25% this Thursday. However, the ECB President, Christine Lagarde, will receive significant attention for potential signals regarding a rate increase in September.
If Lagarde signals a September ECB rate hike, the euro should rise modestly against the dollar, which should offer some indirect support to gold priced in dollars. A dovish Lagarde, conversely, would have the opposite effect. Additionally, the ECB meeting provides insight into the tone of the upcoming FOMC meeting in one week.
What is the gold price target for the week of July 22–28?
Following the triple-bottom breakout, the primary technical targets for the immediate future are $4,185.22 and $4,246.41, the 100-period EMA. LiteFinance currently projects gold to trade between $3,365 and $4,236 throughout July 2026, which puts the $4,246 target slightly above the projected monthly ceiling. If the $4,093 support level holds firm this week and the price closes above $4,138, it would validate the breakout and pave the way for a potential move toward $4,246 prior to the FOMC meeting on July 28 to 29.
- Check out our free forex signals
- Follow the top economic events on FX Leaders economic calendar
- Trade better, discover more Forex Trading Strategies
- Open a FREE Trading Account
- Read our latest reviews on: Avatrade, Exness, HFM and XM

Related Articles



Sidebar rates

Related Posts
 Save
Save