RTX Corporation (RTX) Stock Jumps 7% While S&P Falls; Here’s Why
RTX surges 7% on Q2 EPS beat of 13.7%, $289B record backlog, and guidance raised to $7.10–$7.25. GTF MRO up 40% and $212 technical target...
Quick overview
- RTX shares rose 7% to $208.48 following a strong Q2 2026 earnings report that included a 13.7% EPS surprise and a 7.8% revenue upside.
- The company reported a record backlog of $289 billion, driven by significant new orders, particularly in defense sectors.
- RTX raised its full-year adjusted EPS outlook to $7.10-$7.25 and increased revenue guidance to $95-$96 billion, reflecting strong operational improvements.
- Despite a broader market decline, RTX's performance highlights a trend towards defense and defense-adjacent industries as safe investments amid geopolitical tensions.
On July 23, RTX shares were trading at $208.48, climbing 7% even as the broader S&P 500 slipped 1.16%. This performance came after the company unveiled Q2 2026 results that featured a 13.7% EPS surprise, a 7.8% revenue upside, a staggering $289 billion record backlog, and a full-year outlook boost that surpassed even the most bullish expectations prior to the report. This is not a mild beat. It is a structural re-rating event.
The Numbers That Moved RTX 7% While the Market Fell
The company posted adjusted earnings per share of $1.89 on a quarter that exceeded analyst consensus estimates of $1.66 per share for a 13.7% EPS beat. That represented its best earnings beat of the last five quarters. Quarterly revenue of $24.71 billion beat the $22.91 billion estimate by 7.8%, which is 14.5% revenue growth from a year ago with 16% organic growth.
The company also lifted its full-year adjusted EPS outlook to a range of $7.10-$7.25 per share, versus a pre-earnings consensus range of $6.70-$6.90 and a previously guided range of $6.70-$6.90. Full-year revenue guidance was raised to a range of $95 billion to $96 billion from a range of $92.5 billion to $93.5 billion.
Here are some of the best metrics to measure operational improvement: GTF MRO production increased 40% and engine turnaround time decreased 23%. The company also saw a 25% reduction in aircraft on ground (AOGs), a clear sign the powdered metal inspection program is operating efficiently, not being a runaway cost center.
The backlog rose 22% to a new all-time high of $289 billion. This included $43 billion in new orders in Q2 2026 alone, and nearly $20 billion of that was at Raytheon and included Patriot, Standard Missile, and AMRAAM. Commercial backlog is $170 billion.
Why RTX Is Up While the Broader Market Is Down
Pratt & Whitney’s commercial aftermarket revenue increased 25%, and military revenue increased 23%. Collins Aerospace commercial original equipment (OE) revenue increased 26%, and its aftermarket revenue increased 10%. Raytheon’s revenue was up 18% year-over-year driven by land and air defense, naval programs, and air and space systems.
Also, the company spent $100 million to expand GEM-T production, and another $100 million to add GTF MRO capacity, both ahead of the next order wave to pre-fund the next wave of demand rather than waiting for contracts to hit.
RTX Is Up 7% While the S&P 500 Is Down 1.16%
Lockheed Martin reported a quarter with a beat-and-raise outlook, and RTX also reported a quarter with a beat-and-raise outlook. LMT is up 10% on the day while RTX is up 7%, the S&P 500 is down 1.16% on the day. The reason: Defense and defense-adjacent industries are flight-to-quality.
That’s consistent with one of 2026’s clearest themes as geopolitical demand for air defense, missile systems, and precision weapons are non-cyclical and multi-year, as the 2024-25 NATO procurement commitments are now firm orders, with the $289 billion backlog representing the mathematical evidence of this trend.
Cash on balance sheet is $8.31 billion, and its long-term debt was reduced from $34.29 billion to $31.86 billion. The company is both deleveraging and increasing its backlog.
RTX Technical Analysis: $207.69 Fibonacci Support, $212.47 Next
RTX broke through the 1.272 Fib $207.69 level. This is a confirmation that bullish sentiment is coming back on board. The stock has comfortably moved beyond both the 50-period EMA at $196.02 and the 200-period EMA at $189.73.
Resistance at $212.47 (Top trendline/resistance level) → $217.74 → $221.47
Support at $207.69 (1.272 Fib now support) → $203.88 → $196.00 (support/resistance area).
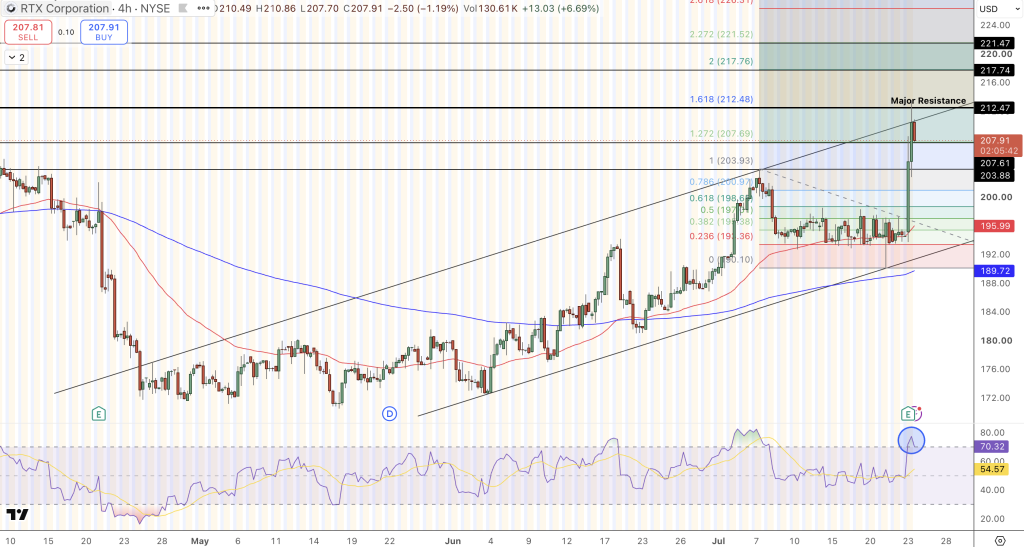
The Relative Strength Index (RSI) reading above 72 indicates an overbought condition, though strong trending rallies have often demonstrated high levels of this indicator for extended durations. A dip to $203.88 would offer a better opportunity to enter ahead of $212.47 on the next push higher.
Strategy:
- Stay above $207.69
- Look for moves to $212.47
- A move to $203.88 offers a good re-entry opportunity
- Protect against a move below $196.00
FAQ: RTX — GTF Progress, Backlog Record, and the $215 Analyst Target
What does the 40% MRO output increase mean for Pratt & Whitney?
The MRO output grew 40%, turnaround time down 23% and AOGs down 25% is a very meaningful metric as this will remove for good the overhang that has hung over RTX for 18 months. In terms of the inspection of the powder-metal, the number of engines that had to be taken to open and inspect each GTF engine on the entire global airbus a320neo fleet, which was faster and better in comparison to expectations set by sell side analysts.
A smaller number of AOGs implies less compensation claims filed by airline customers and less engines waiting for spare parts in repair shops, the result of all of the above being better margins in 2H26.
Why did RTX raise guidance so aggressively?
Adjusted earnings per share guidance was boosted $0.40 from midpoint of $6.80 to $7.18 at the midpoint in the same quarter. The guidance increase is substantial enough to indicate management’s strong conviction the second half results will not just match, but build on the results of the second quarter.
With Q2 seeing $43bn of new awards, with $20bn being at Raytheon alone, a year-on-year revenue ramp with a long lead time to see in this guidance is very much possible and not just wishful thinking.
What is the RTX price target for 2026?
The pre-earnings targets set by analysts had converged on a $215 to $220 price. We expect to see revisions upwards in the weeks following today’s announcement and beat-and-raise. The stock price of the RTX share is now up 30% or more over the previous year.
The 1.272 Fib breakout above $207.69 implies the next logical target is $212.47, with $217.74 and $221.47 being next up targets, which are also close to the revised analyst price targets after this earnings announcement.
- Check out our free forex signals
- Follow the top economic events on FX Leaders economic calendar
- Trade better, discover more Forex Trading Strategies
- Open a FREE Trading Account
- Read our latest reviews on: Avatrade, Exness, HFM and XM

Related Articles
Sidebar rates

Related Posts
 Save
Save