Gold Price Forecast July 24, 2026: $4,028 Defends $4,000 as Brent Hits $100 and September Hike Odds Jump to 80%
On July 24, Gold (XAU/USD) traded around $4,028 after barely maintaining its position above the $4,000 psychological floor.

Quick overview
- Gold (XAU/USD) is currently trading around $4,028, struggling to maintain its position above the $4,000 psychological support level.
- Brent Crude prices have risen above $100 per barrel, contributing to inflation concerns and increasing the likelihood of a September Fed rate hike to 80%.
- Technical analysis indicates that gold has broken below key moving averages, with significant support at $4,000 and a potential drop to $3,964 if this level fails.
- Central banks continue to show strong demand for gold, with a record 45% planning to purchase more in the next year, despite current macroeconomic headwinds.
On July 24, Gold (XAU/USD) traded around $4,028 after barely maintaining its position above the $4,000 psychological floor. Brent Crude rose above $100 per barrel for the first time since May, with the 10-year Treasury yield rising to 4.70%. The probability of a September Fed rate hike increased from 68% to 80%. Gold is in the same predicament it has faced for the last two months.
Geopolitical conflict increases oil prices. Oil price increases triggers inflation which increases rate expectations. Increased rate expectations increases the dollar and yield, and the non-yielding metal loses duo.
Gold Still Falling Following Thursday Events
On Wednesday Gold was priced below $4,165 after Brent Crude rose above $90. The rise triggered inflation concerns and increased Treasury yields which negatively impacts precious metals. The rejection extended to a breakdown of both the 50-period EMA and the 200-period EMA by Thursday’s close, both at $4,069 and $4,079 respectively.
Three events occurred at the same time. First, the European Central Bank kept rates at 2.25%, and Lagarde kept a September hike on the table, stating inflation concerns are tilted to the upside. Second, Brent rose above $100 after Saudi oil tankers were attacked in the Red Sea. Third, the September Fed hike odds increased to 80%, making a Warsh hike likely for the next decision.
According to CME FedWatch, fed funds futures imply roughly an 80% probability that the Federal Reserve’s target rate will be higher following the September 16 FOMC meeting, with markets assigning about a 55% chance of one 25-basis-point hike and roughly a 25% chance of a cumulative 50-basis-point increase. Whereas CME Group reports a probability of 66% for the rates to remain unchanged.
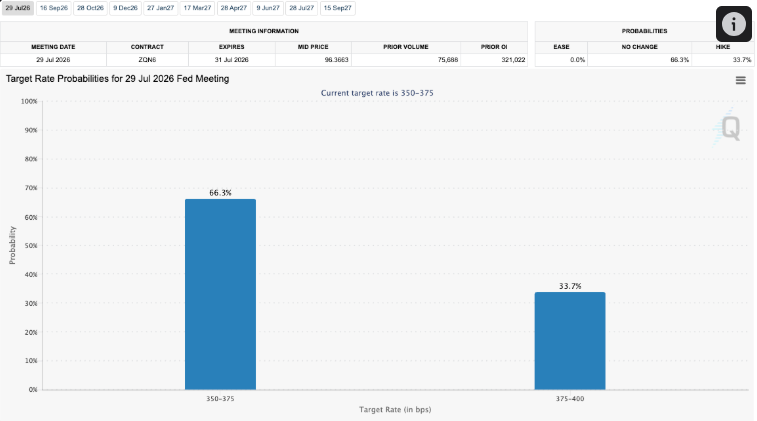
This will not be a meeting about a July move. It will be to see if Warsh will confirm what the bond markets are pricing. A hawkish statement on energy will keep the dollar strong, and yields will remain high while gold is pushed down. A dovish statement will be the Fed looking past $100 crude, a 4.70% on the 10-year, and the highest claims number in 56 years. That is a lot to look past.
The structural floor is still intact. According to the World Gold Council, central banks bought 41 net tonnes of gold in May. Poland bought 18 tonnes, China 10 tonnes, Uzbekistan 9 tonnes, and Kazakhstan and Singapore bought 7 and 4 tonnes respectively.
A record 45% of the surveyed central banks planned to buy gold in the next 12 months. It is a long-duration strategic bid that will not go away due to rate expectations. However, with the concentrated macro headwinds, it cannot prevent a technical breakdown.
Today’s catalyst will be the US July Manufacturing and Services PMI data. A soft PMI will likely result in a soft September hike expectation due to lower growth expectations. A strong PMI will likely increase the September hike expectation due to Warsh having reason to be hawkish as the US economy would be able to tolerate higher rates.
Gold (XAU/USD) Technical Analysis: $4,000 Must Hold or $3,964 Opens Up
Gold (XAU/USD) technical analysis shows gold has broken below both EMAs, sitting at $4,028, with the $4,000 level the only significant support between the current price and the $3,964 triple-bottom base. The bearish trend remains, with a series of lower tops on the swing chart. The 50 and 200-day moving averages are at $4,241 and $4,494, respectively, and continue to limit a price recovery.
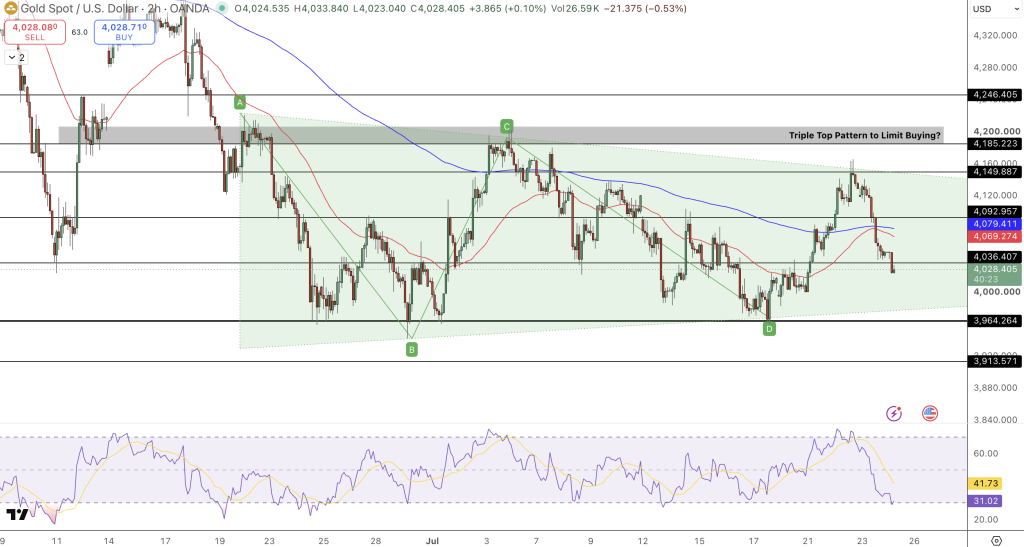
- Resistance: $4,036 (first hurdle) → $4,069–4,079 (50/200-period EMA cluster — must reclaim for bull case) → $4,093 → $4,150.
- Support: $4,000 (psychological support) → $3,964 (triple-bottom and structural support) → $3,886 (next major support if $3,964 fails).
The RSI, at 31, is close to oversold as the target for a likely technical bounce. Oversold conditions do not compensate for the 80% September rate hike.
Trade setup: Long only on a confirmed close above $4,069 | Target $4,093–$4,150 | Stop below $3,964. Current structure favors bears below $4,069.
FAQ: Gold July 24 — Brent $100, September Hike, and the $4,000 Floor
Why does Brent crude hitting $100 hurt gold rather than help it?
Currently, as Brent crude is at $100, we are witnessing the same paradox we have observed all year. This is because oil at $100 creates a inflationary expectation in the Treasuries which causes the yields to rise and increases the cost of holding gold which strengthens the dollar (which makes gold more expensive to foreign buyers).
Under normal circumstances, gold should be at $3,800, $4,300 or even $3,800, but all of these opposing forces exist at the same time. There is a safe-haven demand for gold due to the same geopolitical reasons for raising oil to $100.
What is the FOMC meeting next week the real test for gold?
Chair Warsh’s July 28-29 meeting is not expected to produce a rate change, and the CME Group assigns 66% probability to the rate staying at 3.50 – 3.75%. What is more relevant is how the statements are worded. If Warsh is more specific and cites oil in the context of “inflation risks remaining elevated” and September being a live hike… then the 80% probability September hike is likely, and gold will be tested at $3,964. If oil is considered in the context of a live hike instead, and he cites the current data as a reason for more caution, then the probability of a Sept hike will decrease and gold will bounce toward $4,069 – $4,093.
Is $4,000 a floor or will gold fall to $3,964?
Gold is currently in a short-term retracement zone, which is estimated to be at $4,041–$4,072. The $4,000 mark is important because it has held for the last three of the last six weeks. The price would have to close below $4,000 for three bottom-support tests to be confirmed, and for a fourth test to occur. As a rule, the more tests on a price support level means that it is more likely to break.
The support line from structural factors like demand from central banks, geopolitical factors, and long-term inflation, falls around $3,886. The PMI figures released today in July indicate that gold may gain some short-term support, depending on the state of the economy.
- Check out our free forex signals
- Follow the top economic events on FX Leaders economic calendar
- Trade better, discover more Forex Trading Strategies
- Open a FREE Trading Account
- Read our latest reviews on: Avatrade, Exness, HFM and XM

Related Articles
Sidebar rates

Related Posts
 Save
SaveAva