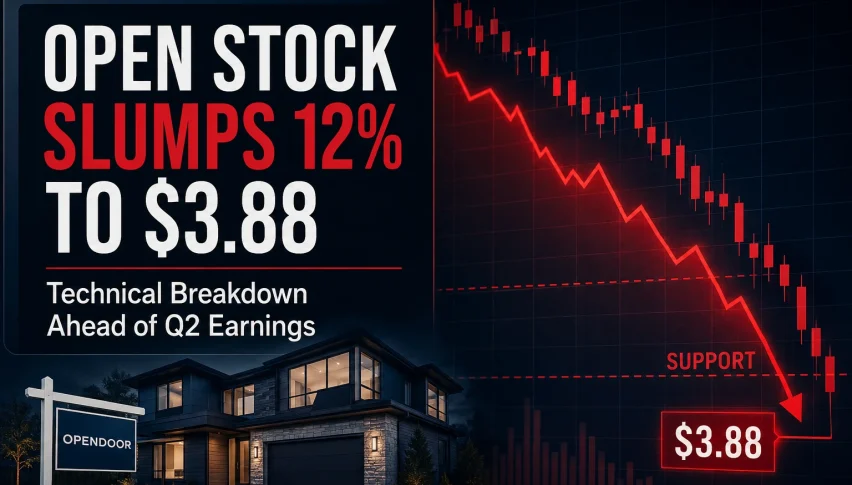
OPEN Stock Slumps 12% to $3.88 as Technical Breakdown Exposes Lower Support Ahead of Q2 Earnings
Opendoor (OPEN) stock drops 12% to $3.88 amid technical breakdowns and mixed analyst calls ahead of Q2 earnings. Read the full analysis.
Quick overview
- Opendoor Technologies' stock fell over 12% to $3.88 amid broader market declines and technical breakdowns.
- Concerns about profitability and upcoming earnings have led to skepticism among investors, with analysts divided on the stock's valuation.
- Despite holding significant cash reserves, Opendoor's negative margins and declining revenue projections raise questions about its future performance.
- Technical indicators suggest a bearish outlook, with the stock needing to reclaim key resistance levels to avoid further downside.
Opendoor Technologies shares came under severe selling pressure on Thursday as a broader market retreat, technical breakdown across all major moving averages, and mixed Wall Street analyst recalibrations combined to send OPEN stock over 12% lower to $3.88.
Opendoor Technologies Inc. (NASDAQ: OPEN) shares suffered a sharp downside reversal on Thursday, highlighting the lingering vulnerability in high-beta real estate technology names. After attempting to stabilize in the upper $4.00 range earlier in July, OPEN once again failed to hold key technical levels, raising fresh concerns that the stock’s recent recovery may be giving way to a deeper corrective phase.
The selloff reflects a combination of technical deterioration, fundamental profitability headwind concerns, and caution ahead of the company’s upcoming second-quarter earnings release. Investors are increasingly questioning whether Opendoor’s valuation and cash burn trajectory can withstand persistent housing market friction and elevated interest rate environments.
Market Sentiment Shifts Ahead of Opendoor Q2 Earnings Catalyst
The fundamental narrative for Opendoor remains tightly bound to its high-volume, thin-margin iBuying model. While the company holds roughly $999 million in cash reserves and maintains high working capital liquidity, negative net margins and an expected EBITDA loss continue to make the stock a speculative vehicle rather than a fundamental value play.
Investors are now looking ahead to August 4, 2026, when Opendoor is scheduled to report its second-quarter financial results.
Wall Street consensus estimates project:
-
Revenue: $900.86 million (down sharply from $1.57 billion in Q2 2025)
-
Earnings Per Share (EPS): A loss of $0.03 per share (compared to a loss of $0.01 per share in Q2 2025)
In an environment where market participants are actively de-risking high-beta growth stocks, year-over-year contraction on both top and bottom lines provides limited incentive for conservative buyers to step in before management clarifies its profitability trajectory.
Analyst Community Deeply Divided on OPEN Valuation
Wall Street sentiment surrounding Opendoor remains fractured, with price targets spanning a wide range that reflects vastly different fundamental assumptions.
The recent recalibration by Keefe Bruyette—bumping its price target from $2.25 to $2.65 while keeping an Underperform rating—underscores the underlying skepticism. While the target bump acknowledges incremental business improvement, the persistent Underperform tag warns that the current trading price near $3.88 may still reflect an overly optimistic recovery scenario.
Valuation vs. Sales: Is OPEN Overvalued Relative to Growth?
On a traditional Price-to-Sales (P/S) basis, Opendoor trades at approximately 1.1x sales. On the surface, this appears discounted relative to the broader real estate sector average of 2.6x and closely aligned with direct peer group multiples of 1.2x.
However, fair value P/S models suggest an adjusted fair multiple closer to 0.7x after factoring in business execution risks, inventory holding costs, and negative returns on equity. This structural gap indicates that despite headline multiples appearing modest, OPEN stock screens as premium-priced relative to its underlying fundamentals.
OPEN Technical Analysis: Momentum Turns Against Bulls
From a technical perspective, Thursday’s breakdown pushed OPEN stock into a high-risk posture. The price structure across short- and medium-term timeframes confirms that sellers maintain firm control of the tape.
OPEN 4-Hour Technical Indicator Summary
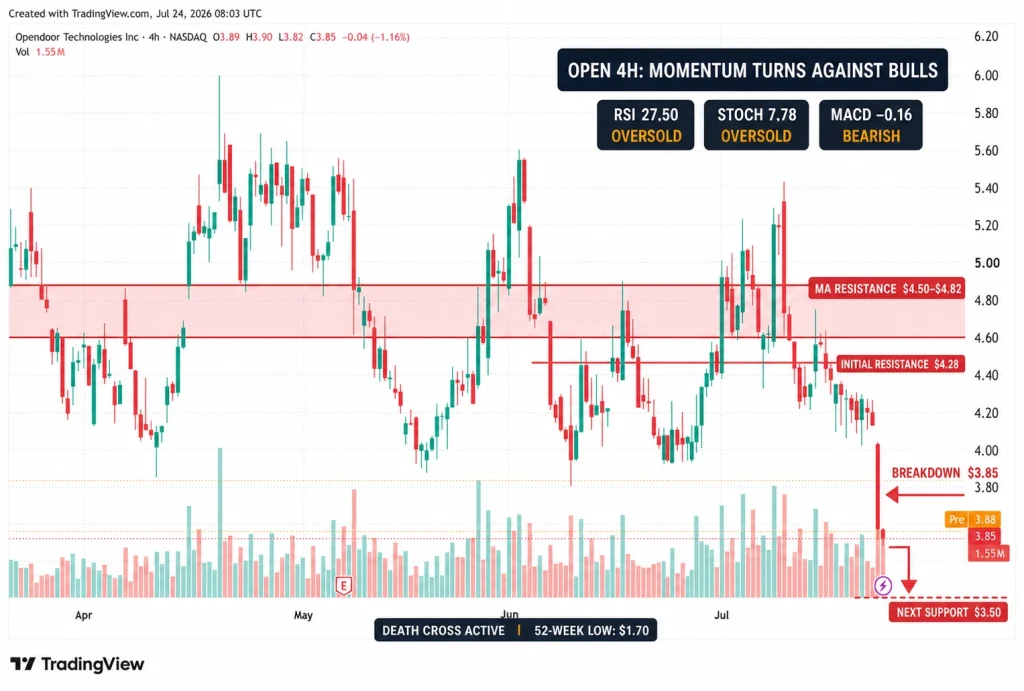
Oscillator readings on the 4-hour chart, such as an RSI of 27.50 and a Stochastic %K of 7.78, indicate deeply oversold short-term conditions. However, oversold momentum indicators alone have failed to spark meaningful buying interest while moving averages continue to slope downwards.
Moving Average Compression Limits Recovery Attempts
The overhead technical configuration presents a formidable barrier for bullish traders:
-
The Death Cross Impact: A death cross formed earlier this year when the 50-day moving average dropped below the 200-day moving average. This pattern continues to enforce ceiling resistance on intermediate relief rallies.
-
Layered Resistance: The stock currently trades well beneath its 10-day SMA ($4.34), 20-day SMA ($4.50), 50-day SMA ($4.59), and 200-day SMA ($4.82).
-
MACD Divergence: The MACD level sits negative at -0.16 with a expanding lower histogram, confirming that downside momentum remains active.
Unless buyers can stage a high-volume push back above initial resistance at $4.28 and challenge the key $4.60 pivot zone, the chart structure leaves the stock exposed to testing lower demand levels toward $3.50, with the multi-month lower reference anchored near the 52-week low of $1.70.
The $4.28 Resistance Stings as $3.50 Level Comes into Focus
Opendoor Technologies sits at a critical crossroad heading into the end of July. While the stock’s substantial cash reserves ($999M) provide operational runway and short-term liquidity, its negative profit margins and shrinking year-over-year revenue profile leave little room for operational missteps.
The technical setup shows clear alignment between short-term momentum and medium-term trend indicators, both favoring sellers. For bulls to regain control, OPEN must first stabilize above the immediate $3.85–$3.88 overnight low and print a decisive recovery above $4.28.
Failure to reclaim those key moving averages before the August 4 earnings announcement could result in continued downside volatility, making any upcoming rally vulnerable to fast profit-taking and short-seller positioning.
- Check out our free forex signals
- Follow the top economic events on FX Leaders economic calendar
- Trade better, discover more Forex Trading Strategies
- Open a FREE Trading Account
- Read our latest reviews on: Avatrade, Exness, HFM and XM

Related Articles



Sidebar rates

Related Posts
 Save
Save