Gold Price Forecast: Fed Decision, Central Bank Buying and $4,021 Support in Focus
Gold moved in a narrow range on Wednesday as investors refrained from positioning aggressively ahead of the Federal Reserve’s...

Gold moved in a narrow range on Wednesday as investors refrained from positioning aggressively ahead of the Federal Reserve’s upcoming rate announcement, with a higher dollar keeping prices down but Middle East tensions cushioning declines.
Spot gold was last quoted at $4,029 an ounce, August COMEX gold futures were off about 0.2% at $4,028, according to Reuters. The yellow metal has been stuck in a trading range of late, balancing expectations on US monetary policy and a continuation of geopolitical risk.
Fed rate decision the biggest near-term driver for gold
The Federal Open Market Committee is wrapping up its two-day meeting on Wednesday. The policy statement will be released at 2 p.m. ET, and Fed Chairman Kevin Warsh will hold a news conference at 2:30 p.m. ET, Reuters said.
Futures markets assign a 70% chance that the FOMC will keep rates steady, and a 30% probability of a 25 basis point increase, Reuters added. It also assigns a 76% probability of at least another rate increase in September.
As the July meeting will not include new economic projections, investors will scrutinize the policy statement and Warsh’s remarks for any hints as to whether policymakers see inflation as sufficiently sticky to warrant further tightening.
Any hawkish tone will probably lift the dollar and the U.S. Treasury yield, putting pressure on non-interest-bearing gold. However, if there are signs that inflation is easing and that policymakers are taking a softer stance, gold may get a boost.
Higher dollar, higher yields continue to hurt gold
The US Dollar Index remained near a one-month high as markets await the Fed’s policy decision. A stronger dollar drove gold lower to a one-week low earlier this week, Reuters reported. A strong greenback makes bullion more expensive for foreign buyers and weighs on demand from abroad.
Higher Treasury yields, meanwhile, add to the opportunity cost of holding gold, which pays no income. Unless US interest rates start to decline and the dollar eases, those factors are likely to continue providing resistance to gold.
Still, central bank buying and geopolitical risks are propping up gold
For all the pressure from monetary policy expectations, demand from other sources continues to underpin gold. According to the World Gold Council, central banks bought a net 244 tonnes of gold during Q1 2026, continuing a buying trend that began to accelerate in 2022. In May, they bought 41 tonnes, mainly in Poland (18 tonnes) and China (10 tonnes), WGC added.
Furthermore, the WGC’s latest Central Bank Gold Reserves Survey found that 89% of reserve managers expect central bank gold holdings globally to rise over the coming year, and 45% expect their own central banks to continue adding to their gold holdings, WGC reported.
In addition, rising geopolitical risks are preventing a more significant selloff in gold.
Reuters reported that the US shot down multiple Iranian ballistic missiles aimed at US targets in the Middle East on Wednesday, after Iran launched strikes against US bases in Jordan. While efforts to calm the situation continue, the escalation has kept investors seeking safe-haven assets, and there is concern about supply disruptions and inflation.
ETF outflows show investor demand still mixed
Demand from investors remains mixed even as central banks continue buying gold.
According to the WGC, investors withdrew $8.9 billion from physically backed gold ETFs during June as higher real yields and a stronger US dollar prompted investors to scale back their gold exposure.
North American ETFs accounted for $5.5 billion of the redemptions, bringing the region’s net inflows to the lowest level for the first half of the year since 2013. European funds lost $818 million in June. The region held up better than expected despite June’s softness. Gold ETFs in Asia attracted a record $12 billion in the first half of 2026, buoyed by continued strength in Indian and Chinese retail demand. This underlines the different dynamics that exist between official sector and Asian investors, who continue to support gold prices while western flows remain heavily influenced by rate cut expectations.
GDP and PCE Inflation Data Could Determine Gold’s Future Direction
After the Fed meeting, gold traders will look to Thursday’s US economic data. The US Bureau of Economic Analysis will release the advance estimate for second-quarter gross domestic product (GDP) along with the June personal consumption expenditures (PCE) Price Index, which is the Fed’s preferred gauge of inflation.
These reports have the potential to alter market perceptions ahead of September’s policy decision. If the data comes in above consensus, traders will see this as an argument for tighter monetary policy; conversely, softer readings could reduce the burden on the Fed and give another boost to gold.
Gold Technical Analysis: Descending Triangle Keeps $4,021 Support On Test
Despite the macro backdrop driving the current move, the technical setup shows that XAU/USD is nearing a pivotal moment. XAU/USD remains inside a descending triangle pattern. Price action has printed a series of lower highs, respecting the downward-sloping trendline.
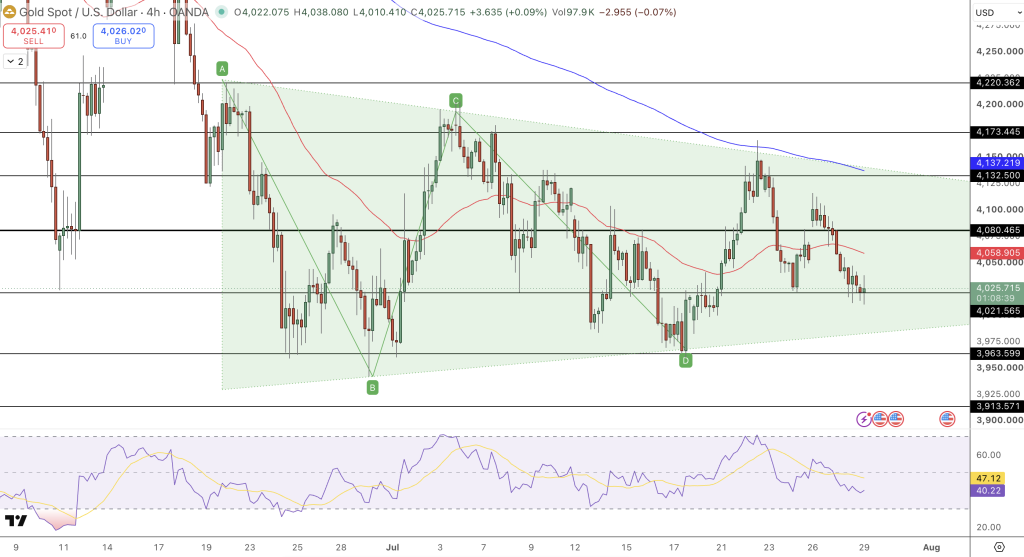
However, buyers continue to defend the rising trendline and the horizontal demand zone around $4,021. Recent price action shows bearish candlesticks, indicating that momentum has shifted to the sellers following several failed attempts to hold above the $4,080 mark.
Bearish EMA Alignment Supports the Bearish Thesis
The technical structure turned bearish when XAU/USD broke below the 50-period EMA at $4,058, which has since become dynamic resistance. Price also remains below the 200-period EMA at $4,137. As the 50-period EMA is below the 200-period EMA and both EMAs are sloping downward, any rally may be met with selling unless buyers can clear the $4,058-$4,080 resistance zone.
The descending triangle pattern is also indicative of decreasing volatility, meaning there is potential for a sharp move following the Fed announcement.
RSI Suggests Bears Still Have Control
Bearish momentum is still dominant according to momentum indicators. The Relative Strength Index (RSI) is currently around 39, remaining below the midpoint at 50. The indicator is not yet in oversold territory, which suggests there is potential for further downside before sellers run out of steam.
$4,021 Support is Key for Determining the Next Major Move
The $4,021 support level is the key price point to watch as it represents a combination of horizontal support and a rising trendline that has provided support throughout the recent pullback.
If bulls can maintain the level, it may lead to a bounce off to $4,058, followed by $4,080. Clearing both would put $4,132 and the 200-period EMA at $4,137 in play, improving the overall outlook. However, a decisive move below $4,021 would signal a bearish break of the descending triangle pattern and put $3,964 into play. Further downside could be seen towards $3,914 if selling pressure intensifies.
Resistance: $4,058, $4,080, $4,132, $4,137
Support: $4,021, $3,964, $3,914
Gold Market Outlook: Fed Guidance May Be More Important Than a Rate Decision
The precious metal enters one of the most crucial sessions of the quarter with mixed technical and fundamental signals. A strong US dollar, higher Treasury yields and higher rate expectations are still weighing on the market. Conversely, ongoing central bank purchases, robust Asian demand and growing geopolitical risks are providing underlying support.
Technically, the asset is at a critical juncture near $4,021, where the bottom of the descending triangle meets horizontal support. Whether XAU/USD bounces or continues its decline will likely come down less to whether the Fed cuts rates or not and more to the language the Fed uses to guide the market regarding the outlook for inflation and interest rates over the coming months.
- Check out our free forex signals
- Follow the top economic events on FX Leaders economic calendar
- Trade better, discover more Forex Trading Strategies
- Open a FREE Trading Account
- Read our latest reviews on: Avatrade, Exness, HFM and XM

Related Articles


Sidebar rates

Related Posts
 Save
Save