Gold’s ABCD Pattern Comes to an End, What’s Next?
On Friday, our Forex Trading Signal on gold helped us secure +100 green pips by hitting our target at $1285. Let's look at what we can expect this week…
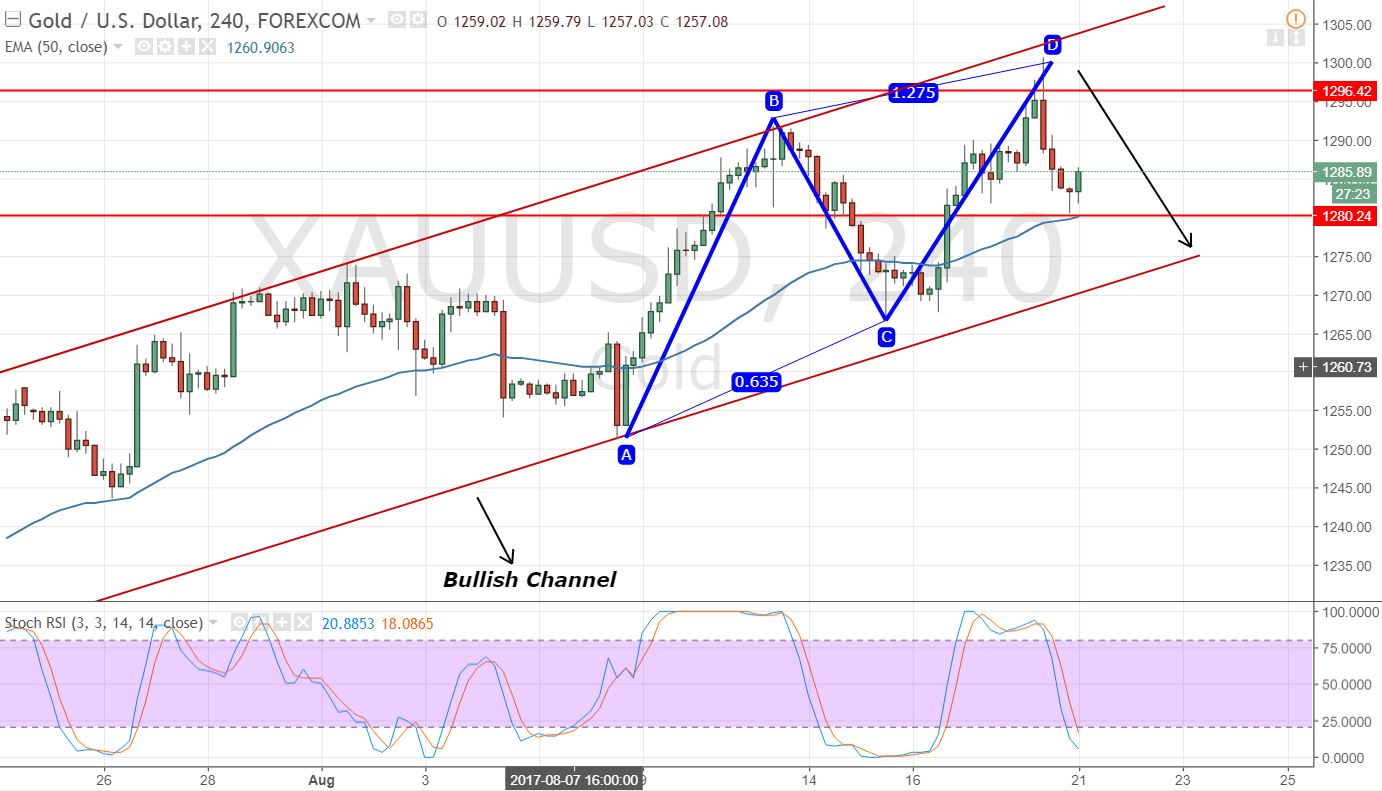
Before we proceed further, in my previous update ABCD Pattern – Gold Bulls Looming at C we had discussed the ABCD pattern that was taking place. Now, the gold has completed the ABCD pattern by soaring from $1267 to $1299 over the previous week.
Gold – Key Technical Drivers
On the 4 Hour Chart, the gold has tested the upper boundary of a bullish channel at $1299, remember. This is the same level where gold completed its ABCD pattern.
Looking at leading indicators, the gold has entered the oversold territory, which is signaling that bears should wait for a retracement to take another entry in gold.
 Gold – 4-Hour Chart – Retracement
We can see a slight bullish movement in gold until $1288 (38.2%) and $1292 (61.8%) the Fibonacci retracement levels. The gold has formed a nice hammer on the 4-hour chart, which is also supporting a reversal in gold.
Gold Trading Plan
Due to it being Monday, the volatility is likely to remain low and the market may show us choppy sessions. To deal with this, I'm looking to enter a buy position at $1280 to target $1292. On the other hand, I will be staying in a sell position below $1293 to target $1272, perhaps later this week.
Good luck fellows looking towards another profitable week!


 Gold – 4-Hour Chart – Retracement


