Gold Retesting Bearish Trendline – Trade The Breakout!
Howdy traders. Our forex signal on Gold was doing really awesome as it was making more than 40 pips on Friday. Unfortunately, it missed clo
Howdy traders. Our forex signal on Gold was doing really awesome as it was making more than 40 pips on Friday. Unfortunately, it missed closing at our target level of $1,286 despite the fact that it placed a low of $1,285.55. Are you still ready to trade? That's what I'm looking to do with Gold today!
Gold // XAUUSD – Technical View
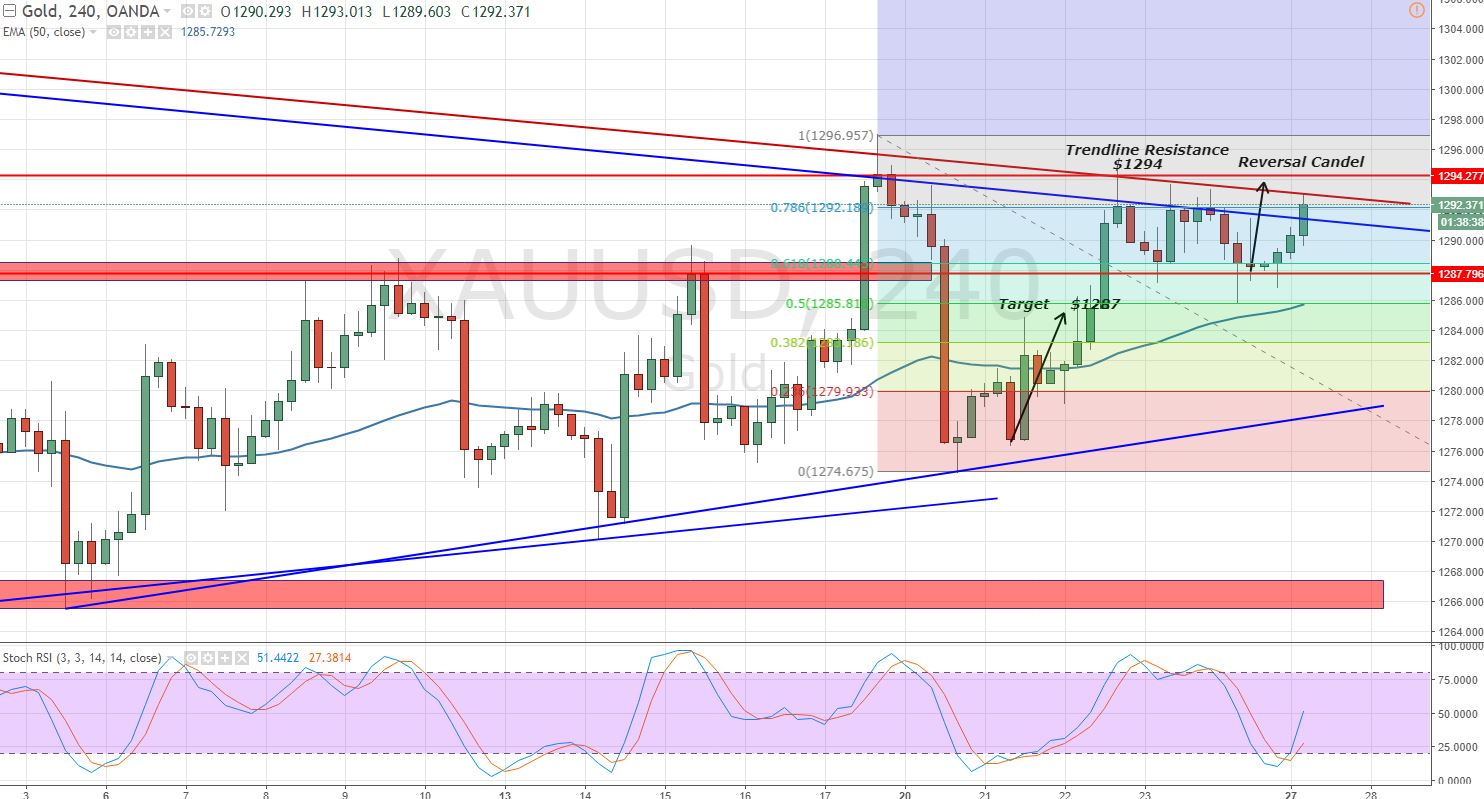
On the 4-hour chart, a long-term trendline connecting with the high of Sep. 20 and Nov. 17 is proving a solid turning point to Gold at $1,294. Gold has formed a candlestick pattern "Doji" and "shooting star" which is signaling a potential bullish reversal. The oversold Gold is now coming out of the oversold zone. Stochastically is at 52 and RSI at 27.
 Gold – 4 – Hour Chart – Trendline Resistance
 Gold – 4 – Hour Chart – Trendline Resistance
 We also had a bullish crossover on the 50 periods EMA. Now the market is holding above it and the only hope is the resistance level of $1,294. The break above this will help Gold enter the $1,300 zone.
Gold // XAUUSD – Trading Plan
Since we are already in the Sell below $1,292 with a stop above $1,294, I'm going to stick with it. Buying entry seems good only above $1,295 whereas, sell is safer below $1,294. Good luck and keep following for more updates.
- Check out our free forex signals
- Follow the top economic events on FX Leaders economic calendar
- Trade better, discover more Forex Trading Strategies
- Open a FREE Trading Account
- Read our latest reviews on: Avatrade, Exness, HFM and XM
Related Articles
Sidebar rates
