DAX30 Makes the Bullish Leap but Faces the 50 SMA on the Daily Chart
After falling for three weeks which began at the end of July and lasted until mid-August, DAX30 made a bullish turnaround two weeks ago.
After falling for three weeks which began at the end of July and lasted until mid-August, DAX30 made a bullish turnaround two weeks ago. Although, last week the price action was pretty boring and DAX traded in a really tight range.
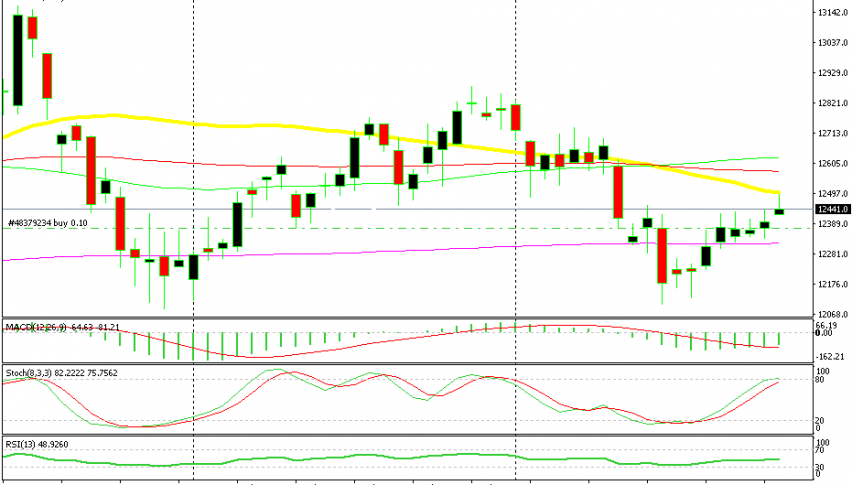
The range was defined by the support level around 12,330 at the bottom and by the 50 SMA (yellow) on the top on the H4 chart. If you check the H1 chart, you can also see that the 100 SMA was helping the 50 SMA in providing resistance.
The 50 SMA was briefly broken last Friday as the price finally closed above the 50 SMA. But the break didn’t count since the price closed pretty close to the 50 SMA. But this morning, DAX30 opened with a bullish gap higher which made the break valid.
But, if we switch to the daily time-frame chart, we see that the price reached the 50 SMA (yellow) here and then started pulling back lower. This is not a good sign for buyers like us. We would have loved it if the bullish momentum continued further up and the price overcame the 50 SMA. But, that didn’t happen, so it is what it is.
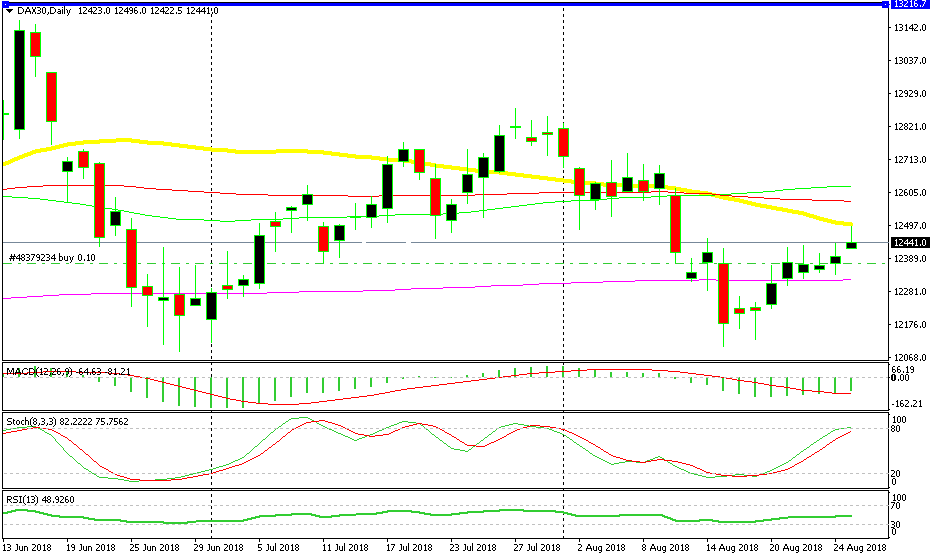
Today’s candlestick looks bullish but let’s see how it will close
We are in a retracing mode now and the first thing that comes to mind is the gap. Gaps often get closed as the price retraces to the closing price of the previous period. The previous period, which was Friday’s close, closed at 12,395. That would mean a 60 pip decline from the current levels.
We would still be in profit with our DAX signal if the price closed the gap and turned bullish again after that. But, the daily chart doesn’t look that promising for buyers. As we said, the 50 SMA rejected the price immediately when we reached that moving average earlier today.
That wasn’t a good sign for us. But there’s more. The stochastic indicator has just reached the overbought area and the chances are that it might return bearish now. Although, in the last hour the price action has looked promising for the buyers so perhaps the buyers will ignore the chart setup and do their thing. Well, we’re about 100 pips in profit now so let’s give it some more time. Nikkei is leading the way up, so the signs look good at the moment.
- Check out our free forex signals
- Follow the top economic events on FX Leaders economic calendar
- Trade better, discover more Forex Trading Strategies
- Open a FREE Trading Account
- Read our latest reviews on: Avatrade, Exness, HFM and XM
Related Articles


Sidebar rates
Related Posts
