Shorting the Pullback in NZD/USD
NZD/USD has retraced higher during the Asian session, but the retrace is complete now and we decided to go short on this pair
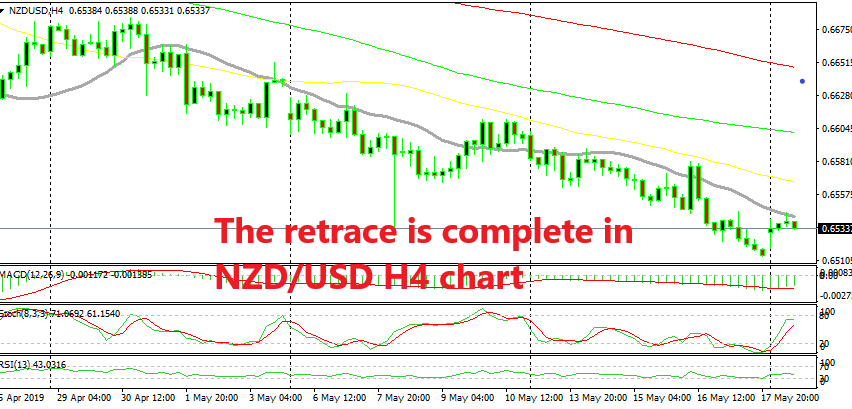
Earlier this morning we decided to go short on NZD/USD as this pair was retracing higher. If you follow our signals, you should have received a notification for that. Anyway, let’s have a look at the chart setup to see why we decided to take this trade here.
As you can see from the H4 chart above, this pair opened with a 15 pip gap higher last night and it pushed higher during the Asian session. I am not sure what was the reason for this gap, but Commodity Dollars have been retracing higher, although the sentiment hasn’t changed in financial markets as USD/JPY and stock markets have turned bearish again today.
In fact, the trade war is escalating as China is said to suspend business with suppliers who have agreed to stop supplying to Huawei. But, NZD/USD made a pullback higher nonetheless which presented a good opportunity for us to sell this pair. Perhaps it was the jump in Japanese GDP for Q1 which we saw overnight.
On the H4 chart above, you can see that the pullback ended at the 20 SMA (grey). So it seems that this moving average turned into resistance this time. The 50 SMA (yellow) and the 100 SMA (green) have been providing resistance before for NZD/USD, but it seems that the 20 SMA was the target for buyers this time.
Besides that, the price formed a small doji candlestick below the 20 SMA, which is a reversing signal. The stochastic indicator was also overbought, which meant that the pullback was complete, so down we went on this pair. Now we are waiting for the reversal.
- Check out our free forex signals
- Follow the top economic events on FX Leaders economic calendar
- Trade better, discover more Forex Trading Strategies
- Open a FREE Trading Account
- Read our latest reviews on: Avatrade, Exness, HFM and XM
Related Articles

Sidebar rates
Related Posts
