Weekly Crypto Roundup
Although Bitcoin had a small pullback, the cryptocurrency market remains bullish.
Although Bitcoin had a small pullback, the cryptocurrency market remains bullish. With an eye on the important key levels, we’ll find out where Bitcoin, Ethereum, XRP, and the cryptocurrency market are heading next.
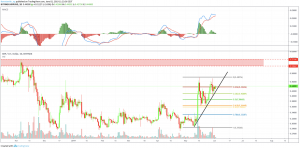
BTC/USD DAILY CHART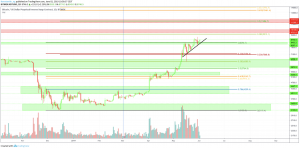
Bitcoin surged all the way up to $9111 where it faced harsh rejection and immediately retraced down to the trendline support, which crosses the support between $8200 and $8450. As long as this support holds, we can expect Bitcoin to test the $9600-$10,000 regions, where the $10,000 mark acts as a strong psychological level. Additionally, the 0.382 fib extension level at $9512 acts as additional resistance. If Bitcoin breaks those levels, the next resistance is at $11,500 and $13,500. In case of a bearish downturn, Bitcoin finds major support between $6000 and $6800 and also minor support at $7200. Judging solely based on the daily chart, a continuation of the uptrend seems likely.
BTC/USD WEEKLY CHART
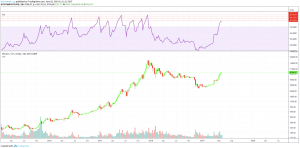
When looking at the weekly chart, the RSI is in very high overbought regions. While the RSI could further increase and reach as high as its previous highs, it seems likely that Bitcoin retraces very soon. With the RSI currently being at 79, it has about two points room to the upside until the RSI reaches a major resistance at 81, where a retracement seems very likely to follow. Thus, Bitcoin might experience a few more bullish days for up to two weeks before a major correction is likely to take place.
ETH/USD DAILY CHART
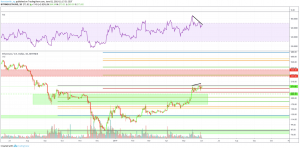
Ethereum follows the trend of Bitcoin, although the bearish divergence in the RSI indicates a correction in the not-too-distant future. Ethereum’s next bullish target is between $360 and $420 while its next support is between $200 and $220. For now, a re-test of the $300 mark seems likely before a correction takes place.
XRP/USD DAILY CHART
XRP reached as high as its previous high at $0.475 and retraced shortly after down to the 0.382 fib level at $0.40, where it quickly bounced to the upside again. For now, XRP’s trend is very bullish as long as the trendline holds. The next resistance is found between $0.53 and $0.57 while XRP’s support is located at the $0.40 mark. In contrast to the bullish outlook, the MACD is losing traction and indicates downward movement in the near future.
I expect XRP to outperform Bitcoin’s uptrend in the upcoming months, based on the previous Fibonacci analysis. Though, a correction of Bitcoin will drag XRP down due to the positive correlations of Bitcoin and the cryptocurrency market.
TOTAL CRYPTO MARKET/USD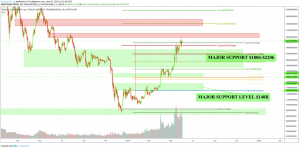
The total cryptocurrency market faced rejection at the $280 resistance this week. However, it quickly recovered its downward movement and is currently on its way to re-test the region again.
The biggest gainers of this week were
MONA, which surged by 240 percent,
BSV, which gained by 130 percent and
FTM, which continued its uptrend by 30 percent regardless of the recent price dump of Bitcoin.
- Check out our free forex signals
- Follow the top economic events on FX Leaders economic calendar
- Trade better, discover more Forex Trading Strategies
- Open a FREE Trading Account
- Read our latest reviews on: Avatrade, Exness, HFM and XM
Related Articles

Sidebar rates
Related Posts
