Crude Oil Retreats $2 Lower, But the 20 SMA Holds for Now
Crude Oil might bounce off the 20 SMA if it holds as support
Crude Oil turned quite bullish for about a year, as it climbed from $-37 to $68 by March this year. We saw a nearly 9 cent retreat from the second week of March, but the retreat ended with March and the bullish momentum resumed resumed again in April as the USD weakened.
The price climbed to $65.50 for US WTI Oil, despite the OPEC+’s Joint Ministerial Monitoring Committee agreeing on Tuesday to increase global crude oil supply from May onwards after revising its demand growth forecasts for 2021 the day before.
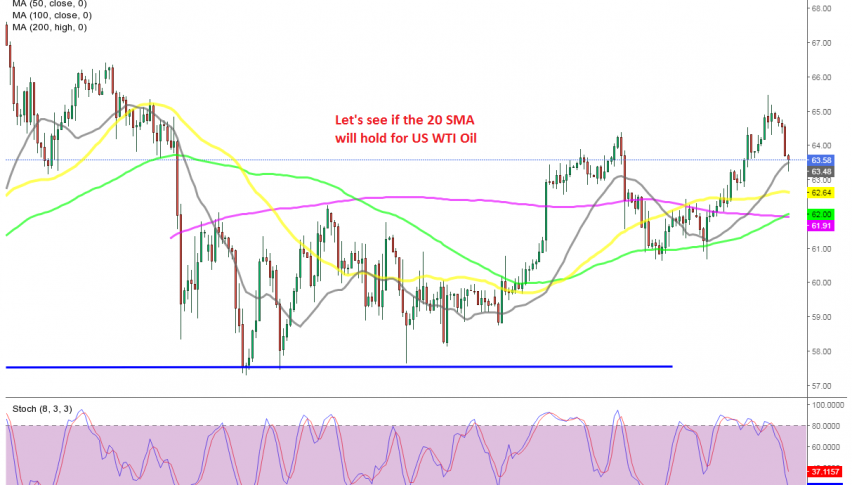
Although, today we are seeing a decent pullback lower, after the price reversed down yesterday. Now the price is trading above the 20 SMA (gray) on the H4 chart, but it pierced that moving average for a while. Although the price pulled back up.
If this H4 candlestick closes as a pin/hammer above the 20 SMA, then that would be a bullish reversing signal and we might go long from there, since the stochastic indicator is becoming oversold on this time-frame chart. But, we will follow the price action to see if the 50 SMA will hold. If it doesn’t, the next major target will be the 100 SMA (green) which has acted as support before, at around $63, where the 200 SMA (purple) also stands.
- Check out our free forex signals
- Follow the top economic events on FX Leaders economic calendar
- Trade better, discover more Forex Trading Strategies
- Open a FREE Trading Account
- Read our latest reviews on: Avatrade, Exness, HFM and XM
Related Articles


Sidebar rates
Related Posts
