Binance Coin (BNB) Showing Mixed Signs: Can Buyers Break Past $400?
It may be too soon to cheer, but it looks like Binance Coin (BNB) is attempting to recover the previous session's losses, climbing higher
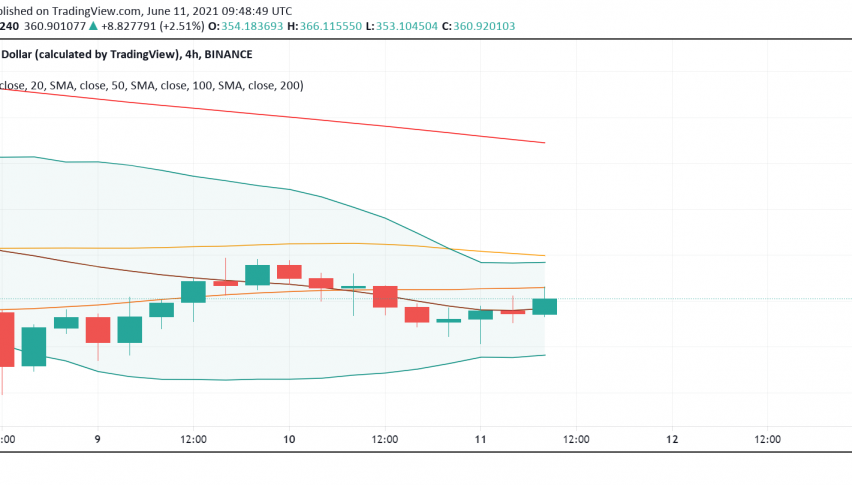
It may be too soon to cheer, but it looks like Binance Coin (BNB) is attempting to recover the previous session’s losses, climbing higher in early trading on Friday. At the time of writing, BNB/USD is trading around $360, down by around 4% in the past 24 hours.
The native token of the world’s largest cryptocurrency exchange sure has a lot going for it, despite the recent downtrends in the crypto market. Investor interest in cryptocurrencies is on the rise, both at the retail level as well as among financial institutions, and higher trading activity on the exchange is a key contributor to the bullishness in BNB.
Despite the promising long-term outlook for Binance Coin, at the moment, technical analysis of the 4-hour price chart for BNB/USD is throwing up mixed signals. On the one hand, the smaller moving averages and technical indicators MACD and momentum are suggesting a bullish bias on the digital asset.
On the other hand, however, the larger moving averages are indicating a build-up of selling pressure, possibly owing to the market sentiment. Unlike most other cryptocurrencies, the market sentiment plays a very important role in driving the value of BNB as a bearish mood scares investors away and reduces trading volumes on the Binance exchange, causing a drop in the BNB price.
As of now, BNB/USD is trading not too far from the pivot point at $378 and if we see more buyers jump in, we could see the bullish momentum build up and take its price higher, possibly even beyond $400 to test resistance at $425. However, a further deterioration in the mood among investors could see Binance Coin head down to the support at $330 and even lower towards $300.
- Check out our free forex signals
- Follow the top economic events on FX Leaders economic calendar
- Trade better, discover more Forex Trading Strategies
- Open a FREE Trading Account
- Read our latest reviews on: Avatrade, Exness, HFM and XM
Related Articles


Sidebar rates
Related Posts
