Shiba Inu Analysis – The Support Holds for SHIB/USD, but the Buying Pressure has Diminished
Shiba Inu has retreated lower in the last 2 days, but the 50 daily SMA holds as support
The dog/meme coins showed great signs of weakness after the crash in the crypto market in May. They lost considerable value over the last few months and were showing no signs of reversing higher, with buyers nowhere to be seen.
The situation was looking increasingly bearish when the reversal came in the forex market in the last week of July. Most of the cryptocurrency market surged higher during that time, but Shiba Inu and Dogecoin were not showing any bullish signs. They were stagnating while other cryptos were showing some great buying momentum, which was another bearish sign in the meme coins.
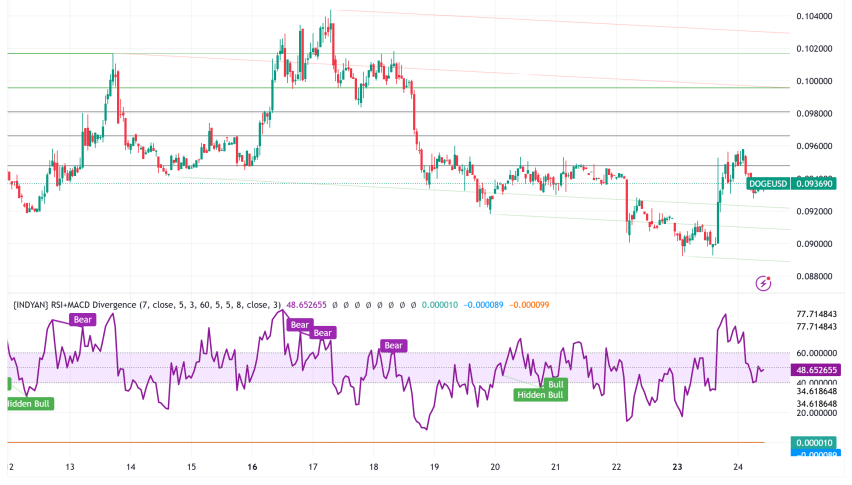
Shiba Inu Analysis – SHIB/USD Daily Chart

The 50 SMA has turned into support for Shiba Inu after the failure at the resistance
But, the jump finally came in the second week of August, as we highlighted on our Shiba Inu 2021 forecast, so the price action of the previous months looked more like a bear trap. Dogecoin bounced off the moving averages, which were providing resistance and keeping this cryptocurrency down on the daily chart, as shown above.
The Shiba Inu coin popped above the 50 daily SMA (yellow), which turned into support right away. Mark Cuban and Elon Musk’s positive comments about Dogecoin helped SHIB/USD as well, although the crypto market sentiment was the main factor for this bullish reversal in meme coins.
That moving average has been holding as support since then, and it is doing so again now, after the failure to push and hold above the first resistance level at $0.0000093. The price is hanging just above that moving average, and it has not been showing any signs of life whatsoever. But, that’s the trading style of meme coins – they remain silent for a long time and then they make a sudden move.
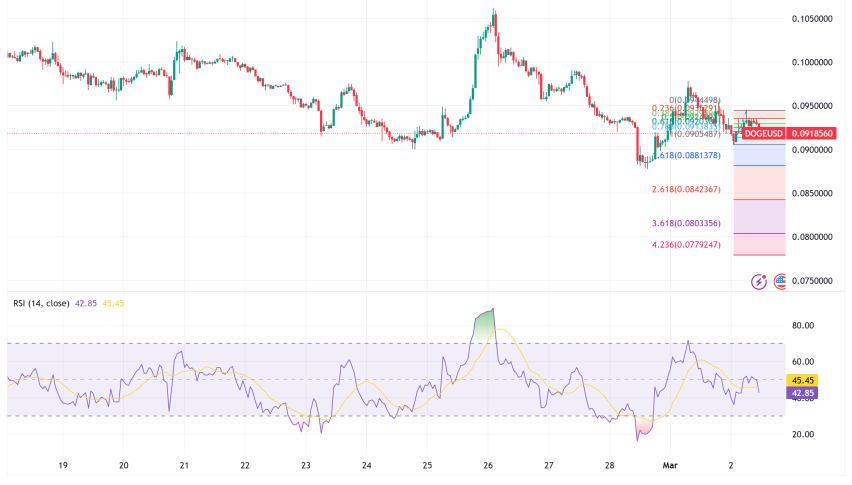
Shiba Inu Analysis – SHIB/USD H4 Chart

Shiba Inu holding steady around the 50 SMA today
On the H4 chart, we see that moving averages were providing resistance in July, when Shiba Inu was declining. It was the 20 SMA (gray) that was pushing the price down in SHIB/USD initially, and with the selling pressure being quite strong, the larger MAs, such as the 50 SMA (yellow) and the 100 SMA (green), were doing their job. That was the first bullish sign, as buyers began putting up the first fight.
Shiba Inu Coin Live Chart
The price bounced higher and the smaller moving averages turned into support, suggesting that the buying pressure had increased. The 20 SMA was providing support last week, then we saw another jump earlier this month once the 50 SMA caught up with the price. But we saw a reversal down on Wednesday, and these moving averages were broken. But in the last two days, the price has been trading within a range, so the selling pressure has stopped for now.
- Check out our free forex signals
- Follow the top economic events on FX Leaders economic calendar
- Trade better, discover more Forex Trading Strategies
- Open a FREE Trading Account
- Read our latest reviews on: Avatrade, Exness, HFM and XM
Related Articles
Sidebar rates
Related Posts
