Giving S&P500 Another Go at the 100 Daily SMA
S&P500 looks great to go long right now at the 100 daily SMA
The stock market has been on a bullish trend since the coronavirus crash in March last year. This has been the strongest rally in history, with S&P500 more than doubling in price, as it climbed from 2,200 points in March 20202 to 5,550 early this month.
The price bounced off the 100 SMA (green) on the monthly chart, after the crash as coronavirus spread around the world. In fact, moving averages have done a great job providing support on different time-frames. Before the 100 SMA, the 50 SMA (yellow) provided support for S&P in 2018, during the height of the trade war between the US and China. Since the second bounce, S&P500 hasn’t looked back and moving averages haven’t been able to catch up with the price on the monthly chart.
S&P500 Monthly Chart Analysis – MAs Hold the Deep Pullbacks

The price hasn’t been able to catch up with S&P since May 2020
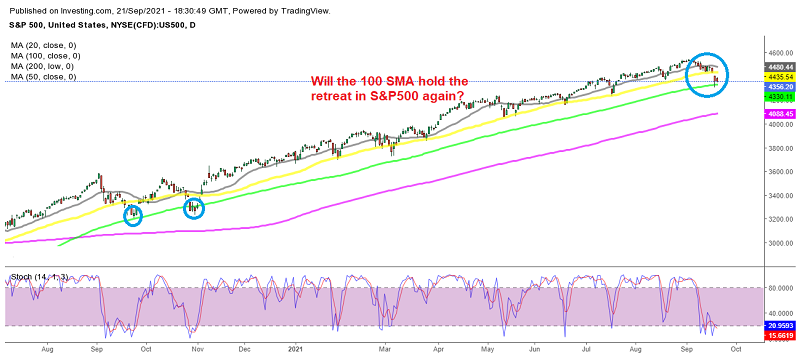
On the daily chart, smaller moving averages have taken turns during pullbacks, namely the 20 SMA (gray), the 50 SMA (yellow), and the 100 SMA (green) when the retrace lower was deeper. This shows the uptrend was quite strong.
There has been only one occasion when the 100 daily SMA has been broken and that was back at the end of October last year. The price didn’t stay below it for too long though and the bullish trend resumed. This time, the 100 SMA was pierced yesterday and we lost our buy signal which we opened at the 50 SMA.
The price fell to $4,305 but pulled back up pretty quickly, even more so than on the previous occasion. We decided to open another buy signal, since the price action after that quick pullback up shows that there’s strong buying pressure around the 100 SMA. The reason for this retreat lower in stock indices has been the talk in financial circles that central banks might start tapering the excessive stimulus programmes soon, as well as the situation in China. The FED meeting is tomorrow, so we will see if they will announce the tapering in 24 hours time.
“…is primarily driven by technical selling .. However, our fundamental thesis remains unchanged, and we see the sell-off as an opportunity to buy the dip. .. Risks are well-flagged and priced in, with stock multiples back at post-pandemic lows ..”
- Check out our free forex signals
- Follow the top economic events on FX Leaders economic calendar
- Trade better, discover more Forex Trading Strategies
- Open a FREE Trading Account
- Read our latest reviews on: Avatrade, Exness, HFM and XM
Related Articles


Sidebar rates
Related Posts
