Terra (LUNA/USD) and Cosmos (ATOM) Hold Steady at Key Levels

LUNA/USD Approaching Key Level
Terra (LUNA/USD) started October with a strong bullish momentum. The pair moved from $36 to hit an all-time high of $49 on October 4. According to Benzinga, Terra drew bullish sentiments after the Columbus 5 network upgrade early in the month.
LUNA/USD has since retraced to $36, and is still looking bearish as it approaches the support level. Can LUNA/USD reverse, or will the bearish trend open more weaknesses?
– A 4-Hour Chart Outlook
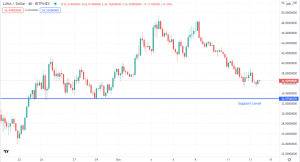
Looking at the 4-hour chart above, LUNA/USD sellers took charge from October 8. The prices are now approaching the $32 support level. LUNA/USD bounced off this level twice, at the close of last month. Prices underwent a minor correction to $38 yesterday, before closing the day at $35.
At the current level, there is no price action signal, which means that LUNA/USD could retest the $32 support or even go lower. However, prices could still jump from the current $36 minor support, as LUNA/USD remains steady at this level, and other crypto tokens are showing renewed bullish sentiment.
LUNA/USD Trade Idea
I would watch the price behavior at the support level of $32. If the price breaks below, the next potential support will be $24, which it tested on September 21. I would wait for bullish price action signals at any level, but preferably at the major support of $32, before going long. For now, I recommend you stay on the sidelines until a potential bullish run begins.
ATOM/USD Holds Steady at $30
Cosmos (ATOM/USD) began a bearish trend at the beginning of October, dropping from $41 to test the $30 support level twice. The move could be connected to the general downward trend in the crypto market.
ATOM/USD also bounced off the descending trendline three times, before breaking out to the upside on October 13. Could the breakout mean a bull run, or will the prices continue moving towards the support?
– A 4 Hour Chart Outlook
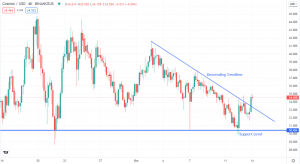
Looking at the chart above, ATOM/USD tested the support at $30 and is currently correcting upwards. The crypto token remained trapped in a descending triangle until October 12, before it broke above it. Can ATOM/USD continue with the bullish momentum to claim its previous highs?
ATOM/USD Trade Idea
I interpret the current break above the descending trendline on ATOM/USD as an attempt by the crypto token to go higher. With the bullish crypto sentiment returning after days of weakness, I see ATOM/USD going higher to claim levels around $37, $39, and potentially, $42.
At the moment, I would wait for a short-term retrace on ATOM/USD before entering a buy trade. Happy trading!
- Check out our free forex signals
- Follow the top economic events on FX Leaders economic calendar
- Trade better, discover more Forex Trading Strategies
- Open a FREE Trading Account
- Read our latest reviews on: Avatrade, Exness, HFM and XM
Related Articles


Sidebar rates
Related Posts
