Polygon (MATIC) Price Analysis: Breaks Key Uptrend Line for the first time, Here’s What to Expect
Polygon (MATIC): A former leader and an outlier in the cryptocurrency market has finally succumbed to the sell-off that has plagued the entire space since late 2021.
Since reaching new all-time highs in November 2021, the major cryptocurrencies, Bitcoin (BTC) and Ethereum (ETH), were down more than 40% at the time of writing with no signs of bottoming yet.
Potential Market Leader Foiled
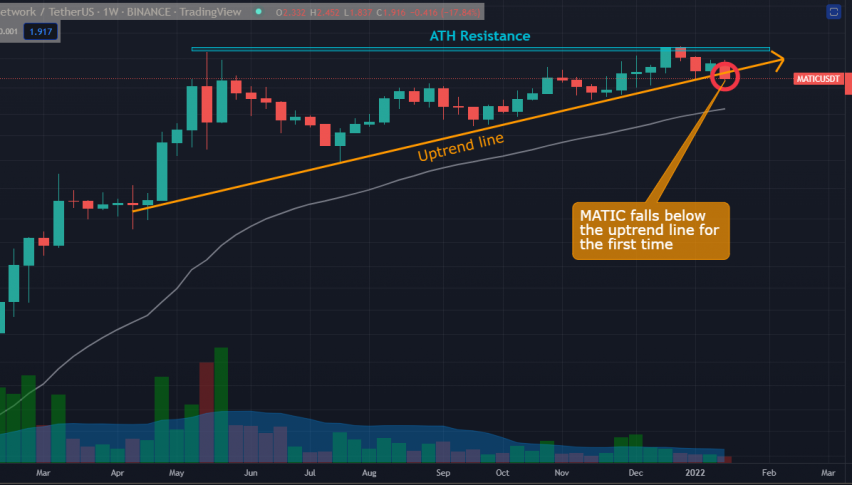
Polygon (MATIC) defied the bearish sentiment on the market by proceeding to rally higher for about a month longer than both Bitcoin and Ethereum, to emerge as a possible new market leader. However, as we entered the new year, this was not to be. Polygon (MATIC) fell from new highs, breaking down a midterm uptrend line, which began in the first quarter of 2021.
Sell-off Due to US Fed Tapering
The sell-off in the cryptocurrency and US equity markets could be directly attributed to the tapering policy of the US Federal Reserve. A possible faster rate of tapering was announced, to curb high inflation in the US. This will negatively affect the capital inflow into risky assets, such as cryptocurrencies and the stock market. Money outflows from both markets have been evident, as cryptos fell into bear market territory, while US equities have been in the red for three consecutive weeks.
What to expect: Four Potential Scenarios for MATIC
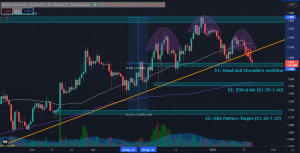
As we can see in MATIC’s daily chart, it fell below the golden uptrend line a few days ago, as selling pressure continued to ravage the cryptocurrency markets. It has also formed a head and shoulders pattern, sometimes referred to as a triple-top pattern, which is a bearish technical pattern that could be interpreted as a loss of buying power on the part of the bulls, as it tried to make new highs a third time. Instead, the bears have taken control, showing selling pressure as they took money off the table, while the overall market showed signs of heightened volatility and risk. Given this, I see four potential scenarios for MATIC in the near future.
- Shakeout Recovery Rally
This is a highly optimistic view, which I believe is not very likely. The recent sell-down below the key uptrend line could be just a shakeout of weak hands by institutional investors. A recovery rally could ensue, which would see MATIC making a strong comeback above $2.00 to 2.40 in the next few days. This is possible, but highly improbable, given the negative sentiment of the overall market.
- Breakdown of S1: Head and Shoulders Neckline
The next scenario would be successful completion of the head and shoulders pattern, by a continual fall below the neckline support, as seen above. In this case, it would most likely fall further towards the next support (S2), which is the 200-day moving average (purple line) of $1.55 to 1.60.
- S2: 200-day MA Relief Rally
Support 2 for MATIC is a relatively strong dynamic support, as it has proven to be in the past. It has fallen below this long-term moving average line at least 3 times in the past year, and each time it has rebounded strongly higher. Observe how the price moves in this area, as it could be a possible opportunity to buy at support, as there’s a high probability that it will create a relief rally at this level. Watch out, however, if it fails to rebound, as this means another leg down for MATIC.
- H&S Pattern Target Achieved, Oversold Bounce
Finally, if MATIC continues to sell down below the 200-day moving average (S2), the next support is the bearish H&S Pattern target at $1.20 to 1.25. The bears may have exhausted their selling pressure at this level, as MATIC would most likely already be oversold at this level. The bulls may begin to come in slowly at this level, as selling might already be too exaggerated here. Watch for possible bounce opportunities at this level.
- Check out our free forex signals
- Follow the top economic events on FX Leaders economic calendar
- Trade better, discover more Forex Trading Strategies
- Open a FREE Trading Account
- Read our latest reviews on: Avatrade, Exness, HFM and XM
Related Articles


Sidebar rates
Related Posts
