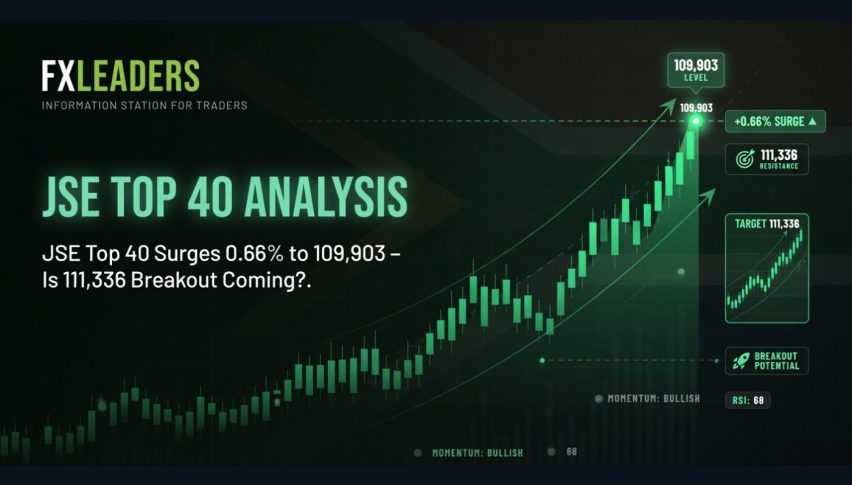
JSE Top 40 Surges 0.66% to 109,903 – Is 111,336 Breakout Coming?
On May 13, 2026, the FTSE/JSE Top 40 Index is at 109,903.5 ZAR, and currently trading at +0.66% daily, continuing its upward trend. Today's
Quick overview
- The FTSE/JSE Top 40 Index is currently at 109,903.5 ZAR, trading up by 0.66% as it continues its upward trend.
- Key drivers for today's gains include improved global risk sentiment, rising precious metal prices, and a stronger rand.
- Resource and mining stocks like AngloGold Ashanti and Gold Fields have advanced, while other major components showed mixed performance.
- The index remains sensitive to global commodity prices and geopolitical developments, particularly in the Middle East.
On May 13, 2026, the FTSE/JSE Top 40 Index is at 109,903.5 ZAR, and currently trading at +0.66% daily, continuing its upward trend. Today’s gains:
Key Drivers Today
- A more favorable risk sentiment globally. Following a U.S.-Iran ceasefire and a partial revival of tankers passing through the Hormuz Strait, a more optimistic sentiment emerged around commodities.
- Resource/mining stocks in the index, including AngloGold Ashanti, Gold Fields, Impala Platinum and Sibanye Stillwater, advanced on the back of rising precious metal prices and a calmer outlook around energy.
- A stronger rand. The local currency was up against the dollar, providing some support for exporters and reducing import costs for local companies.
- Other major components were also mixed. Naspers/Prosus and Richemont were among positive outliers as EM sentiment improved. Bank/consumer names did not fare as well.
While this resource-heavy index should continue to benefit from that composition, it is exposed to global commodity and currency developments, with a large portion of its constituents dependent on the price of oil. The FTSE/JSE Top 40 is also vulnerable to geopolitical developments around the Middle East.
JSE Top 40 Technical Analysis
The index found support at the black descending trendline from March highs near 115,956 and at the blue dynamic MA (108,248 to 109,276) and formed a hammer. The index has formed higher lows since the April low (near 102,464) and continues to build a falling wedge higher. The index has continued inside the main channel.
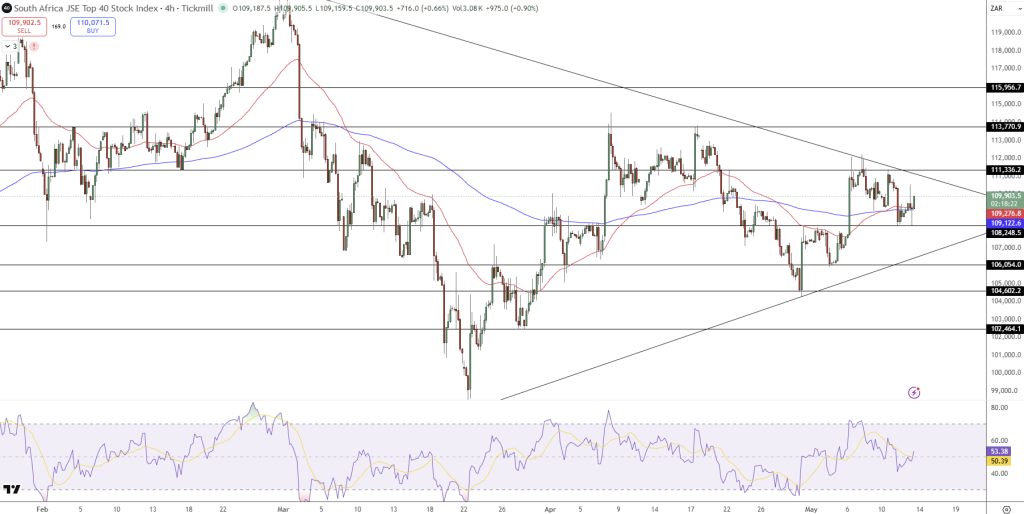
The RSI is rising back to the overbought zone. RSI is showing positive divergence on the dip, signaling weakening bearish pressure. The RSI is above 50-55 which means we are getting closer to the overbought region.
Resistance zones are at 111,336 and at 113,770. Support zones are at 108,248 and at 106,054. Buy above 110,200, targets at 111,336 and at 113,770, stop at 108,248.
Given its heavy tilt to commodities and resource names, the index remains sensitive to oil prices and the rand, plus it’s exposed to geopolitics around the Middle East.
- Check out our free forex signals
- Follow the top economic events on FX Leaders economic calendar
- Trade better, discover more Forex Trading Strategies
- Open a FREE Trading Account
- Read our latest reviews on: Avatrade, Exness, HFM and XM
Related Articles


Sidebar rates
Related Posts
