GBP/USD at 1.25732 Amid BoE Rate Cut Speculation
The GBP/USD currency pair has sustained its downward trajectory, hovering near the 1.2565 level, despite the weakened US dollar.
The GBP/USD currency pair has sustained its downward trajectory, hovering near the 1.2565 level, despite the weakened US dollar. This decline is attributed to the dovish monetary policy stance of the Bank of England (BoE), with market participants increasingly anticipating a rate cut.
However, statements from Federal Reserve officials indicating potential rate cuts initially bolstered the US dollar, though its gains were short-lived.
BoE Rate Cut Speculation Pressures GBP/USD Pair
Traders are betting on an imminent rate cut by the Bank of England (BoE), which is dampening investor confidence in the Pound Sterling (GBP). Concerns regarding easing UK inflation and a subdued market sentiment further weigh on the GBP, reinforcing the downward pressure on the GBP/USD pair.
Fed’s Monetary Policy Outlook and Impact on USD and GBP/USD Pair
The Federal Reserve’s recent discussions on monetary policy have added to market uncertainty. While some officials foresee rate cuts this year, the timing remains uncertain. This anticipation of potential rate cuts, coupled with inflation concerns, could initially weaken the US dollar.
However, uncertainties surrounding the timing and extent of these cuts may also influence the performance of the GBP/USD pair.
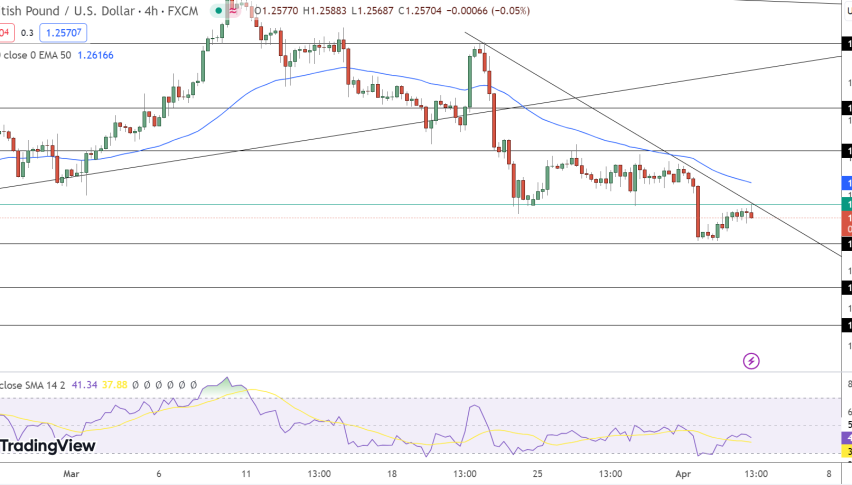
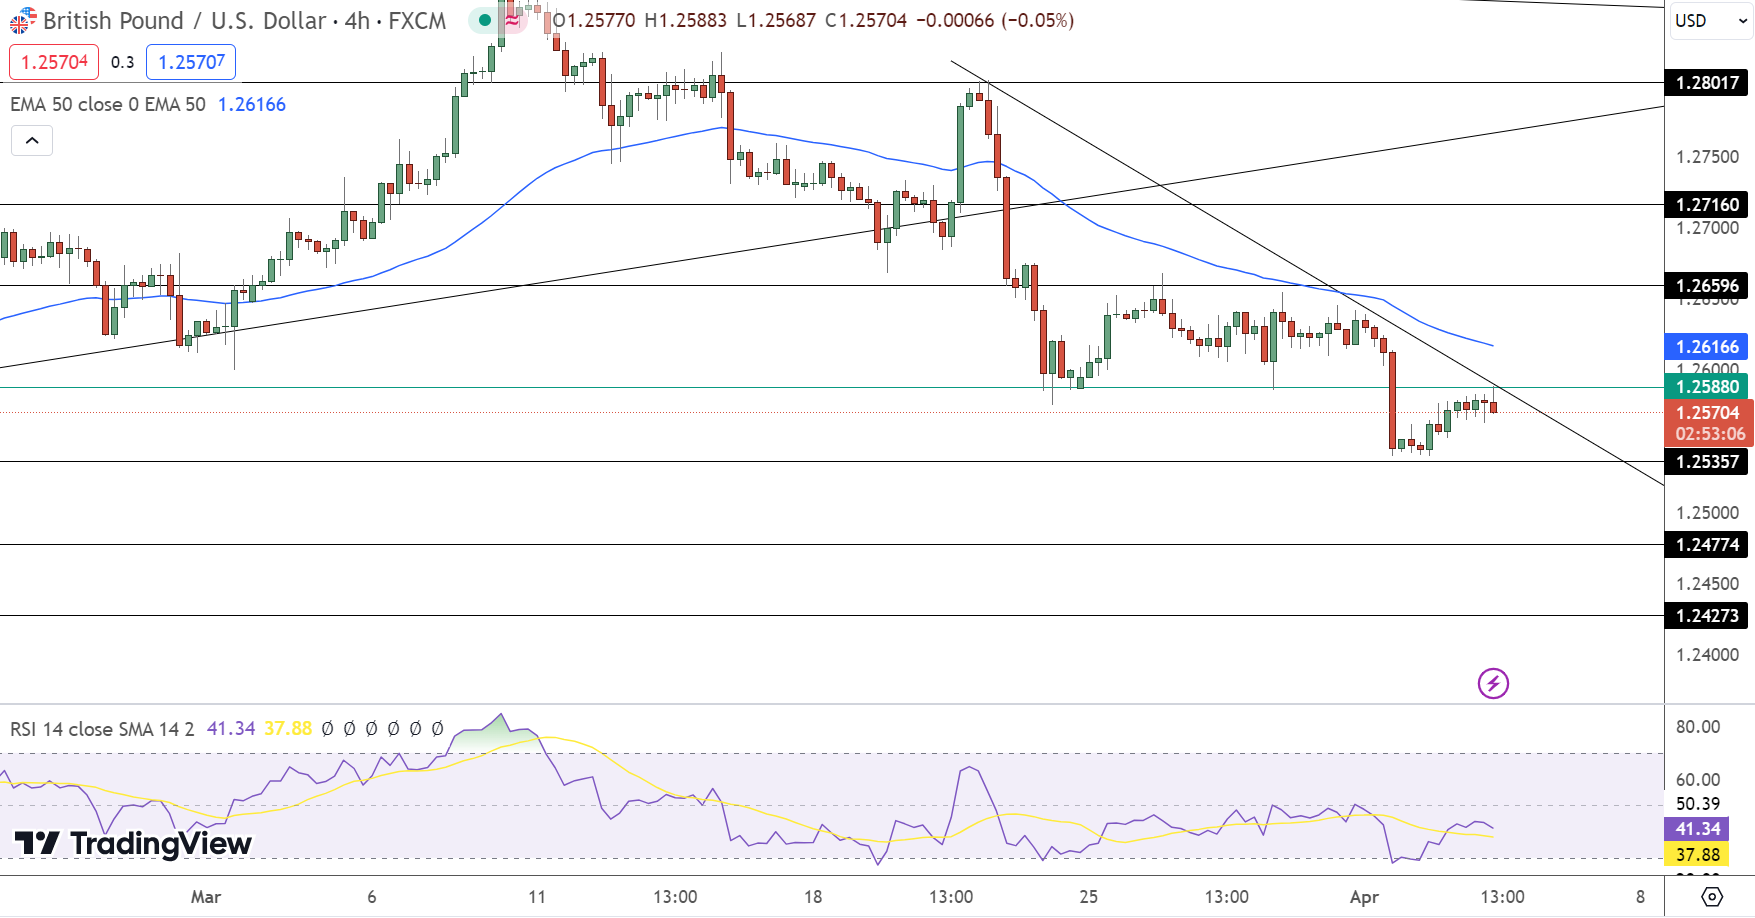
GBP/USD Technical Outlook
In today’s analysis of the GBP/USD pair, the price stands at 1.25732, indicating a marginal uptick of 0.01%. Key price levels reveal a pivot point at $1.25840, with immediate resistance projected at $1.26432, followed by $1.26744 and $1.27017.
Conversely, immediate support is noted at $1.25409, with subsequent levels at $1.25060 and $1.24779. Technical indicators show the Relative Strength Index (RSI) at 47, suggesting a neutral stance. The 50-day Exponential Moving Average (EMA) stands at 1.25966.
The overall trend remains bearish below $1.25840, with the potential for a shift towards a more bullish bias upon breaching this level.
- Check out our free forex signals
- Follow the top economic events on FX Leaders economic calendar
- Trade better, discover more Forex Trading Strategies
- Open a FREE Trading Account
- Read our latest reviews on: Avatrade, Exness, HFM and XM
Related Articles


Sidebar rates
Related Posts
