Breakout Rally Could Propel The Graph (GRT) Price by 60%
The Graph (GRT) has shown substantial positive momentum, rising nearly 16% in the past 24 hours. With a bullish breakout from its...
Despite heightened price volatility in the crypto market, Bitcoin has successfully reclaimed the $65,000 mark. Additionally, top altcoins have experienced significant gains, signaling a shift towards a more optimistic market sentiment.
The Graph (GRT) has shown substantial positive momentum, rising nearly 16% in the past 24 hours. With a bullish breakout from its symmetrical triangle, could GRT reach $0.50 by Q2?
The Graph (GRT) Token Eyes Breakout Rally Amid Market Optimism
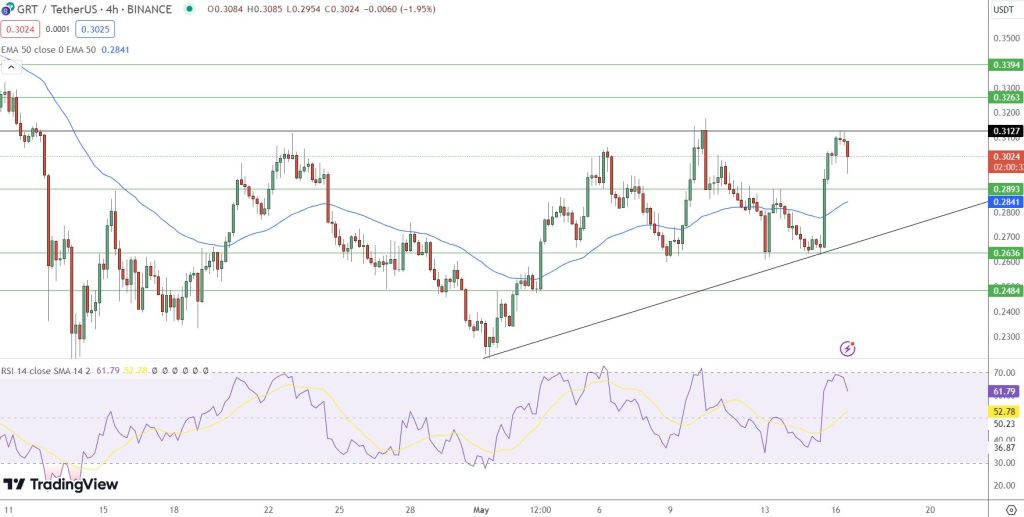
Following rejection at the $0.4950 resistance level, The Graph (GRT) price experienced a significant drop, losing 53.03% of its value. This decline led to the formation of a symmetric triangle pattern on the 1-day time frame.
Currently, GRT is trading at $0.3116, up 16.21% in the last 24 hours, with a trading volume of $214.061 million, marking a 147.99% increase.
Key Points:
- Resistance Level: $0.4950
- Current Price: $0.3116, up 16.21%
- Trading Volume: $214.061 million, up 147.99%
With a bullish sentiment prevailing in the cryptocurrency market, GRT has a strong potential for a breakout rally, aiming to reach higher levels in the coming weeks.
Graph Market Sentiment
The Simple Moving Average (SMA) shows a bullish crossover on the 1-day time frame, indicating a significant increase in buying pressure in the cryptocurrency market. Meanwhile, the Moving Average Convergence Divergence (MACD) displays a consistent rise in the green histogram, signaling strong bullish momentum.
The averages also show a steady increase, suggesting a positive outlook for The Graph (GRT) price in the near future.
Will the GRT Price Reach $1?
If bullish trading persists, GRT will likely test its resistance level of $0.3550 over the next weekend. Should the market sustain this level, the token could target the upper resistance of $0.4225 this month.
Conversely, if the trend reverses, GRT will test the support level of $0.2950. Continued bearish control could push the price below the lower support level of $0.2325 soon.
- Check out our free forex signals
- Follow the top economic events on FX Leaders economic calendar
- Trade better, discover more Forex Trading Strategies
- Open a FREE Trading Account
- Read our latest reviews on: Avatrade, Exness, HFM and XM
Related Articles


Sidebar rates
Related Posts
