US Inflation Sticky, but S&P 500 Prints Another Record High
This week the US CPI and PPI inflation were higher than expectations, but that didn't stop the S&P 500 from making new record highs.
This week the US CPI consumer and PPI producer inflation were higher than expectations, but that didn’t stop the S&P 500 from making new record highs. Stock markets are showing resilience as the odds of another 50 bps FED rate cut have declined, while geopolitical tensions in the Middle East have abated somewhat.
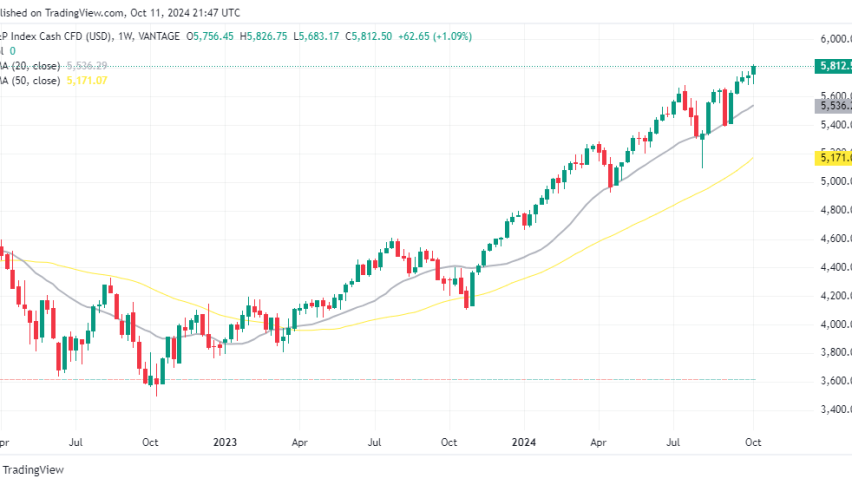
S&P 500 Chart Weekly – The 45th Record High for 2024
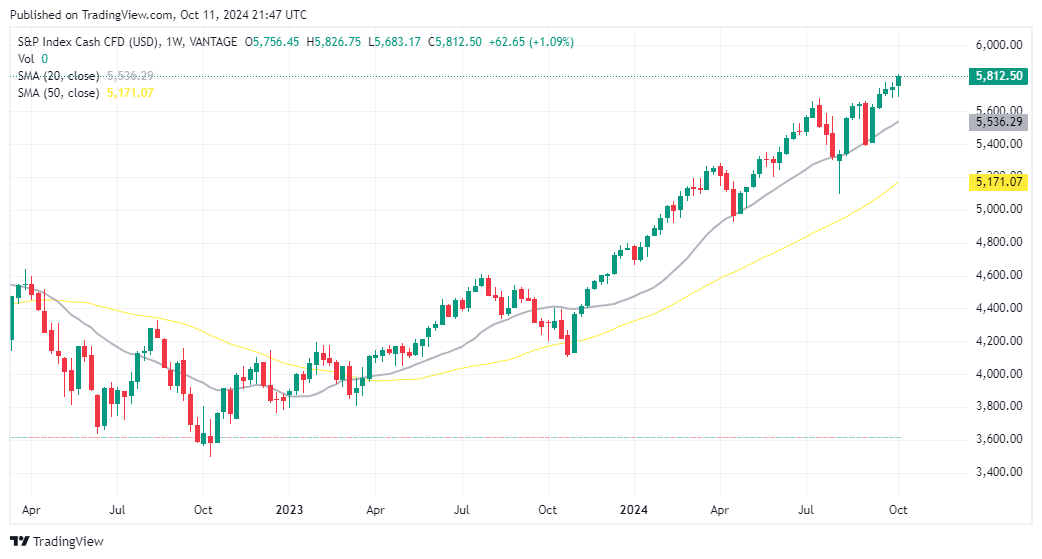
On Friday, the S&P 500 rose by 40 points, nearly 1%, to end the day at a new record high of 5,820. This boost came as the U.S. dollar futures opened higher after being down earlier. The recent hurricane may have played a role in last month’s spike in jobless claims, as shown by Thursday’s report.
Despite this, the rise in claims was enough to weaken the USD, which in turn helped stock markets rally. Both the Dow Jones Industrial Average and the S&P 500 reached record levels, while the DAX and Nasdaq ended the week near their highs. However, the Nasdaq was somewhat restrained by certain tech stocks.
A Snapshot of the Closing Levels for Main US Indices
- Dow Industrial Average: +1.21% at 42,863 points
- S&P 500: +1.11% at 4,815 points
- NASDAQ: +1.13% at 18,342 points
- Russell 2000: +0.97% at 2,234 points
Notable Stock Gainers for the Week:
- Trump Media & Technology Group: +53%
- Uber Technologies: +16%
- Super Micro Computer: +16%
- Robinhood Markets: +15%
- CrowdStrike Holdings: +10%
- Celsius Holdings: +9%
This week, the S&P500 closed at a fresh high, with the Dow industrial average also reaching a new record—making it a clear risk-on environment. The NASDAQ, which closed higher on Friday, is now within 1.5% of its all-time peak set in July at 18,647 points. The increases reflect an easing in Middle East tensions, which has bolstered market sentiment and driven stock markets upward. The US PPI producer inflation came higher on Friday, but that didn’t affect risk sentiment and stock markets much.
US PPI Inflation Report for September
- US PPI final demand for August YoY:
- +1.8% vs +1.6% expected
- Prior month revised from +1.7% to +1.9%
- PPI ex Food and Energy for August YoY:
- +2.8% vs +2.7% expected
- Prior Core YoY revised from +2.4% to +2.6%
- September PPI Month-over-Month:
- 0.0% (flat)
- September PPI ex Food and Energy MoM:
- +0.2%, in line with expectations
- PPI ex Food, Energy, and Trade YoY:
- +3.2% vs +3.3% previous month
- PPI ex Food, Energy, and Trade MoM:
- +0.1%, down from a prior +0.2% (revised from +0.3%)
S&P 500 Live Chart
- Check out our free forex signals
- Follow the top economic events on FX Leaders economic calendar
- Trade better, discover more Forex Trading Strategies
- Open a FREE Trading Account
- Read our latest reviews on: Avatrade, Exness, HFM and XM
Related Articles
Sidebar rates
Related Posts
