S&P500 Index Surge Past 6,000 Amid Trump’s Victory and Fed’s Rate Cut – What’s Next?
S&P 500 futures soar past 6,000 after Trump’s presidential victory and a Fed rate cut, with markets poised for gains. Read on for the full m

This week, S&P 500 futures broke the 6,000-point threshold, marking a historic high driven by political and economic factors.

Markets rallied on positive sentiment following Donald Trump’s re-election and the Federal Reserve’s anticipated 25 basis-point rate cut, reflecting investor optimism in pro-business policies and steady growth prospects. While confidence remains high, concerns about inflation and future Fed policies linger.
For the first time, the S&P 500 maintained this upward momentum, with futures holding steady in early Friday trading. Investors are now assessing the impacts of Trump’s return to office and the Fed’s stance.
Michael Brown, Senior Research Strategist at Pepperstone, highlighted the market’s response as a “continuation of the initial post-election equity gains.” However, Trump’s ambitious fiscal plans may challenge the Fed’s approach in the coming months.
S&P500 The S&P500 is showing us its all-time high on a daily basis😋😍
As expected FED cut key rate by 25 basis points. pic.twitter.com/oI2m2OruAM— The FOMO King (@FOMOHarder) November 8, 2024
Key Points:
-
Milestone Reached: S&P 500 futures above 6,000
-
Fed Rate Cut: 25 basis-point cut boosts optimism
-
Market Outlook: Trump’s policies may complicate Fed’s future moves
Trump’s Pro-Business Policies and Fed Rate Cut Boost Market Optimism
The S&P 500’s rally reflects investor enthusiasm for Trump’s proposed economic policies, including corporate tax cuts and deregulation. These measures are anticipated to lift corporate profits, adding momentum to stock prices. Analysts view Trump’s return as potentially ushering in a business-friendly environment with fewer regulatory obstacles and stronger earnings potential.
Federal Reserve Chair Jerome Powell noted that the election results wouldn’t impact the Fed’s short-term stance, although Trump’s fiscal policies could shift the economic landscape. While the Fed’s recent rate cut supports growth, Trump’s planned spending and possible tariff hikes could drive inflation, potentially prompting a future rate hike.
Analyst Michael Brown commented, “Strong earnings and economic growth, combined with a perceived ‘Fed put,’ are likely to drive the market higher.” However, Trump’s pro-growth agenda may clash with inflation concerns, complicating the Fed’s path forward.
US Markets react to expected Fed cut, yields & dollar slightly softer. All three indexes hit intraday record highs during the session.
🇺🇸Markets on Thursday#DowJones flat#Nasdaq +1.51%
S&P500 +0.74%Fed lowered its benchmark overnight borrowing rate by 25 bps to a target…
— Rupesh kumar (@Rupeshk14829210) November 8, 2024
Key Points:
-
Market Boost: Trump’s pro-business policies fuel optimism
-
Fed’s Stance: Recent rate cut supports expansion, but inflation risks linger
-
Outlook: Rising bond yields reflect inflation concerns, challenging Fed
Technical Analysis: S&P 500 Faces Key Resistance Levels as Overbought Indicators Emerge
As the S&P 500 approaches uncharted territory, technical indicators suggest that the index’s bullish momentum may face headwinds. On Thursday, the S&P 500 closed at 5,973.09, slightly below its intraday high of 5,983.14.
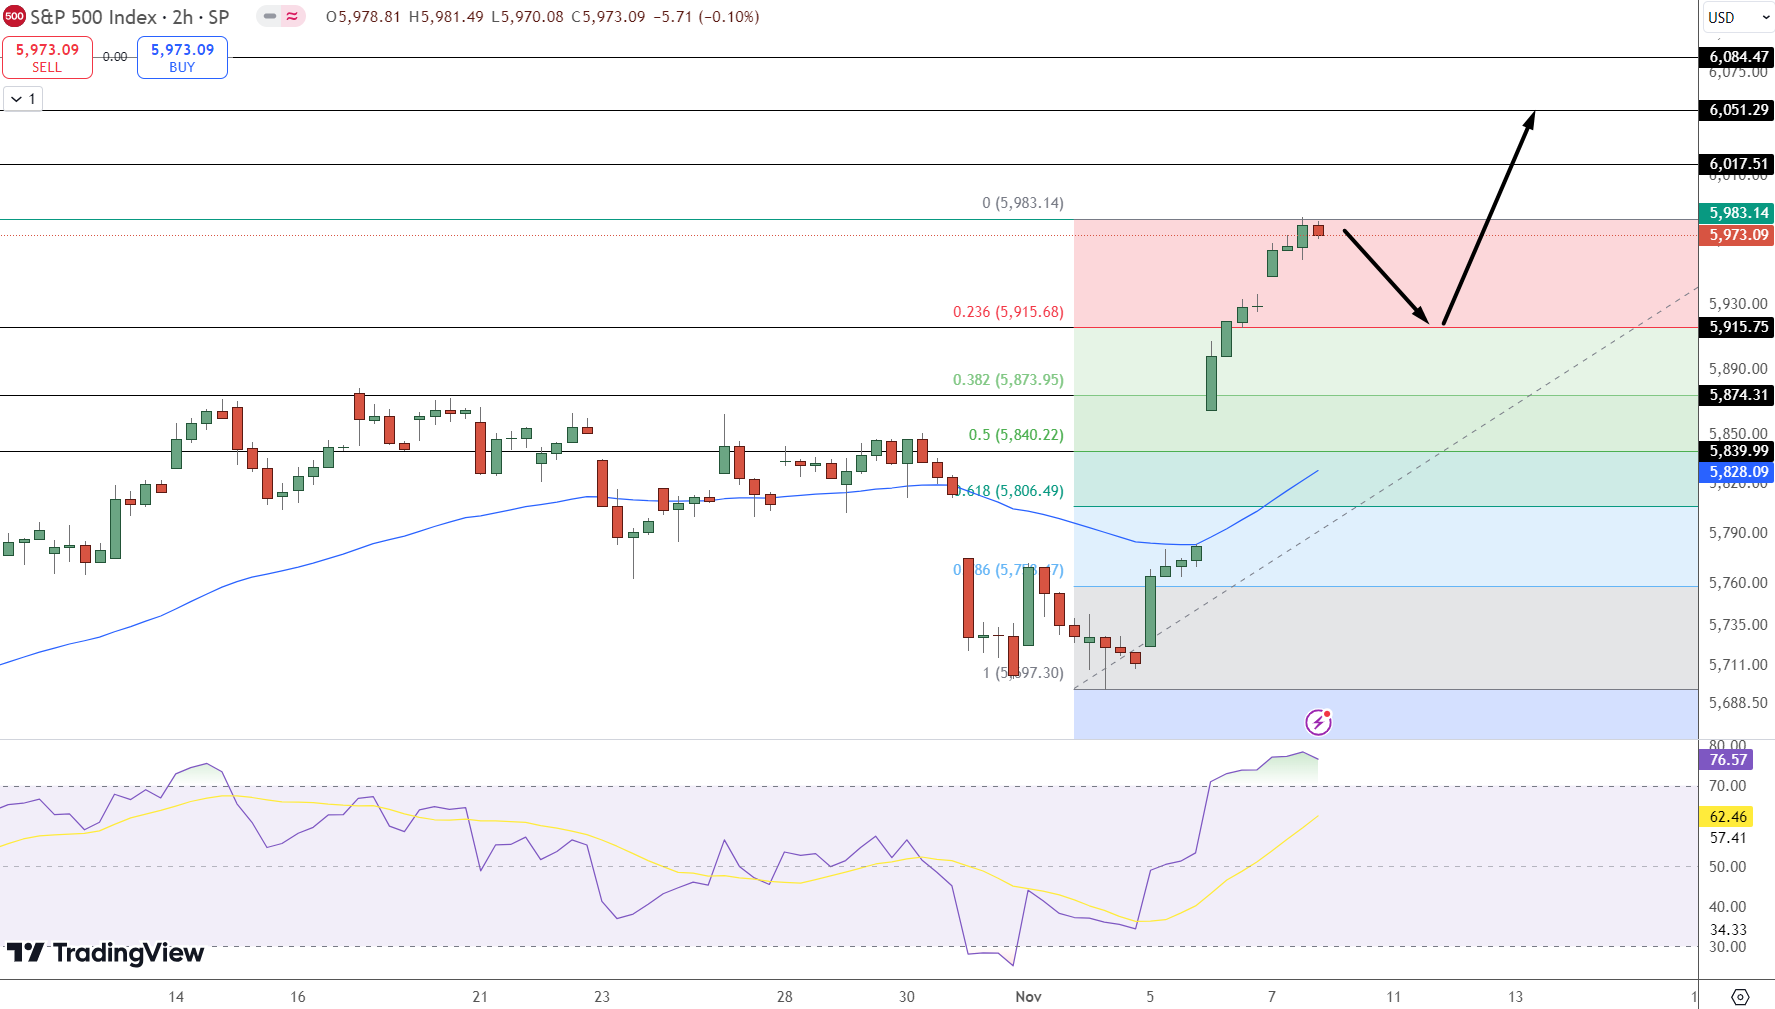
However, a Relative Strength Index (RSI) reading of 76.57 indicates that the market is in overbought territory, suggesting that buyer enthusiasm may be reaching a limit. Furthermore, the appearance of a doji candle on the 2-hour chart—a pattern that often signals indecision or a potential reversal—implies that the rally could be poised for a pause or pullback.
Key Technical Levels to Monitor:
-
Immediate Resistance: The next resistance levels are set at 6,017.51, followed by 6,051.29 and 6,084.47.
-
Support Levels: Initial support can be found at 5,915.75, which aligns with the 23.6% Fibonacci retracement. Below this, stronger support sits at 5,874.31 and 5,839.99, near the 50-day Exponential Moving Average (EMA), which could act as a stabilizing force if selling pressure intensifies.
Technical Indicators at a Glance:
-
RSI: Currently at 76.57, indicating overbought conditions that may precede a price correction.
-
50 EMA: Positioned at 5,828.09, offering a critical support level.
-
Doji Candle Formation: A signal of potential reversal or market indecision, often preceding a pullback in an overbought market.
A drop below the support level of 5,915.75 could signal a more significant correction, drawing the index toward lower Fibonacci retracement levels.
- Check out our free forex signals
- Follow the top economic events on FX Leaders economic calendar
- Trade better, discover more Forex Trading Strategies
- Open a FREE Trading Account
- Read our latest reviews on: Avatrade, Exness, HFM and XM

Related Articles
Sidebar rates

