WTI Crude Oil Price Holds at $70 Amid OPEC+ Talks and Iranian Sanctions
WTI crude oil futures held steady near $70 per barrel on Wednesday, building on the 2.7% gain from the previous session.

WTI crude oil futures held steady near $70 per barrel on Wednesday, building on the 2.7% gain from the previous session.

The rally is supported by reports suggesting OPEC+ is close to finalizing a three-month delay in its plan to increase production. A decision is expected during Thursday’s OPEC+ meeting, alleviating fears of oversupply in the global oil market.
Adding to bullish sentiment, the U.S. announced sanctions on 35 entities and vessels allegedly involved in transporting Iranian crude oil. These measures are seen as tightening the global supply outlook, further supporting oil prices.
However, concerns remain on the demand side, with markets cautious about potential economic slowdowns that could dampen consumption.
U.S. Inventory Data Sends Mixed Signals
On the supply front, the latest API data revealed that U.S. crude oil inventories rose by 1.2 million barrels last week, defying market expectations of a 2.1 million-barrel draw. This unexpected build signals a potential softening in demand or an increase in domestic production.
Additionally, gasoline and distillate inventories posted significant increases, further raising questions about near-term demand recovery.
Despite these data points, traders remain optimistic as broader geopolitical developments and OPEC+ production controls are expected to tighten global crude supply. Any further stockpile increases, however, could limit WTI’s upside potential.
Key inventory highlights:
-
Crude oil inventories: +1.2 million barrels (expected: -2.1 million).
-
Gasoline inventories: Increased significantly.
-
Distillate inventories: Showed substantial builds.
Crude Oil Technical Outlook: Key Resistance at $70.50
WTI crude oil’s technical setup highlights bullish momentum, with the price consolidating above its pivot point of $69.85. Immediate resistance stands at $70.50, followed by $71.28 and $72.08. On the downside, support levels are observed at $69.07, $68.45, and $67.70.
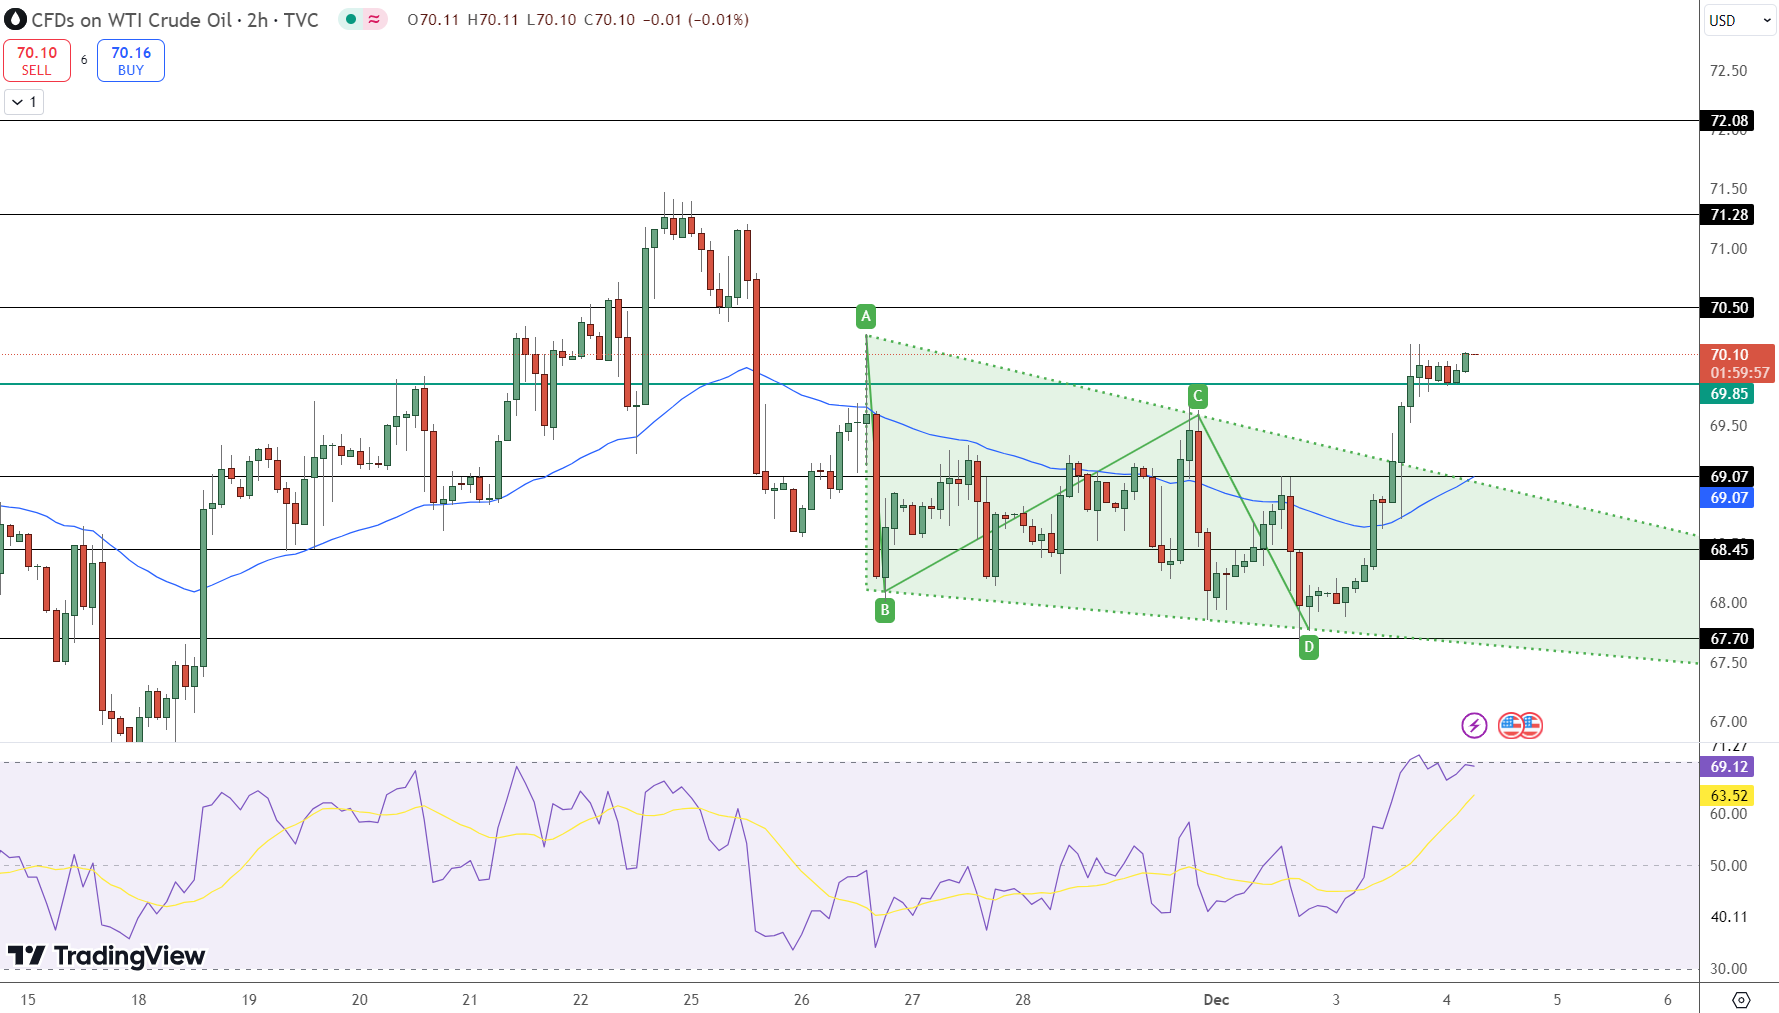
The RSI at 69.12 suggests the market is nearing overbought territory, raising the potential for short-term profit-taking. The 50-day EMA at $69.07 offers a critical support level to maintain the bullish structure.
The breakout from a symmetrical triangle pattern further underscores the commodity’s upward potential, with traders watching closely for a sustained move above $70.50 to confirm a continuation of the rally.
- Check out our free forex signals
- Follow the top economic events on FX Leaders economic calendar
- Trade better, discover more Forex Trading Strategies
- Open a FREE Trading Account
- Read our latest reviews on: Avatrade, Exness, HFM and XM
Related Articles


Sidebar rates
Related Posts
