Gold Holds Steady at $2,647 as Markets Eye U.S. Payroll Data
Gold prices remained flat on Thursday, trading at $2,647.17 per ounce, as investors awaited the release of U.S. payroll data expected to sha

Gold prices remained flat on Thursday, trading at $2,647.17 per ounce, as investors awaited the release of U.S. payroll data expected to shape Federal Reserve rate expectations.

U.S. gold futures dipped slightly by 0.2%, settling at $2,671.10. The anticipation of upcoming economic reports has kept gold in a consolidation phase, with traders gauging the metal’s short-term direction.
Fed Policy Uncertainty Weighs on Gold
The Federal Reserve’s monetary policy trajectory remains in focus. The CME Group’s FedWatch Tool indicates a 73.8% probability of a 25-basis-point rate cut this month, with an 85-basis-point reduction anticipated by the end of 2025. Fed Chair Jerome Powell stated on Wednesday that the U.S. economy has shown more resilience than expected, signaling a potential slower pace of future rate cuts.
San Francisco Fed Bank President Mary Daly echoed Powell’s sentiment, stating, “There’s no urgency to accelerate rate cuts.” Elevated interest rates continue to weigh on gold’s appeal as a non-yielding asset, further curbing demand.
Economic Data Provides Mixed Signals
Private payroll data for November released on Wednesday showed moderate job growth, while the services sector experienced a slowdown but maintained levels consistent with robust fourth-quarter economic growth. However, ANZ Bank cautioned that gold, which has outperformed this year, may take a short-term breather due to recent strength in the U.S. dollar, presenting an additional headwind for the metal.
Looking ahead, the payrolls report on Friday and next week’s inflation data for November are expected to influence gold’s trajectory. Analysts expect these figures to shape both market sentiment and Fed policy.
Gold Technical Outlook: Breakout Imminent
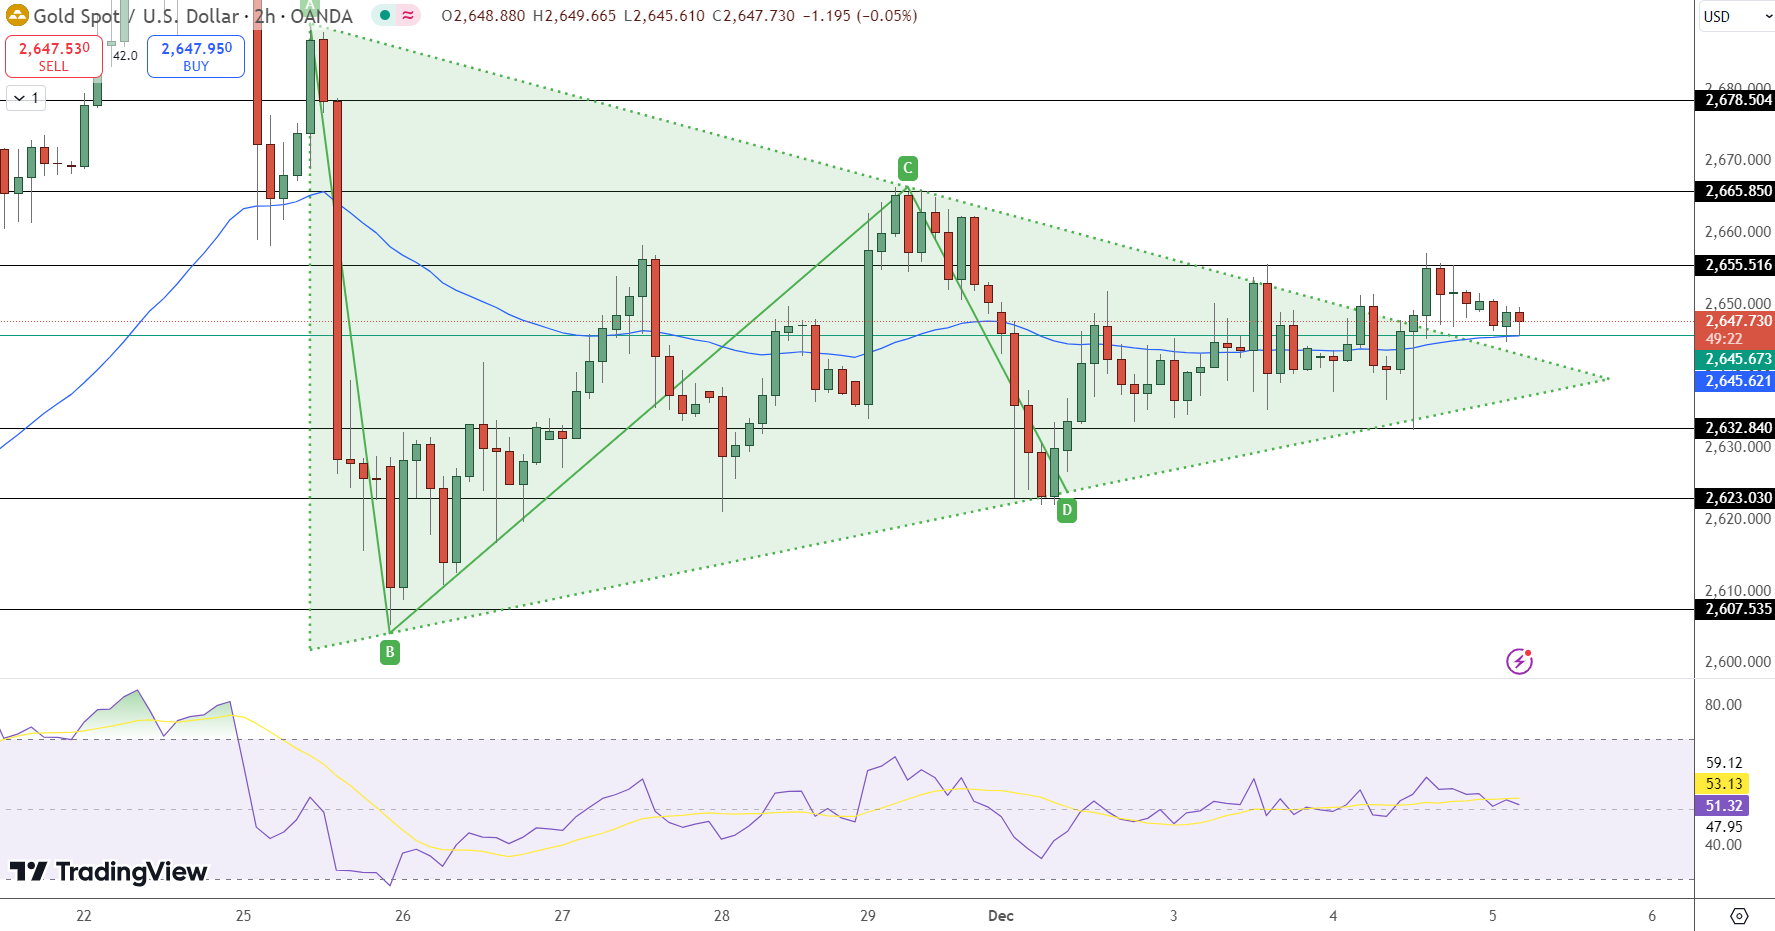
Gold’s technical setup on the 2-hour chart highlights a symmetrical triangle pattern, signaling potential volatility ahead. The pivot point at $2,645.62 anchors current price action, while resistance is seen at $2,655.51, $2,665.85, and $2,678.50. On the downside, support levels are $2,632.84, $2,623.03, and $2,607.53.
-
Indicators: RSI at 53.13 indicates a neutral market stance, while the 50-day EMA at $2,645.67 aligns with the pivot, reinforcing key support.
-
Breakout Potential: A move above $2,655.51 could fuel bullish momentum, while a drop below $2,645.62 may lead to bearish pressure.
- Check out our free forex signals
- Follow the top economic events on FX Leaders economic calendar
- Trade better, discover more Forex Trading Strategies
- Open a FREE Trading Account
- Read our latest reviews on: Avatrade, Exness, HFM and XM
Related Articles


Sidebar rates
Related Posts
