Gold Dips Below $2,650: Is the Next Big Move Coming Soon?
Gold dipped on Wednesday, sitting at $2,647 as US Treasuries and a stronger dollar weighed on the metal. The 10-year Treasury yield...

Gold dipped on Wednesday, sitting at $2,647 as US Treasuries and a stronger dollar weighed on the metal.

The 10-year Treasury yield jumped to an 8 month high after strong US economic data also boosted the dollar index.
Recent US Labor Department numbers showed job openings rose to 8.098 million in November from 7.839 million in October. That’s a strong labor market and takes the heat off of Fed rate cuts in 2025. Now markets are only expecting one rate cut this year vs two just last month according to the CME FedWatch tool.
Gold, a traditional inflation hedge, can’t compete with high yield assets in a rate environment. The Fed’s dovish outlook is still weighing on the market and traders are on edge ahead of Friday’s nonfarm payrolls.
China’s Gold Reserves and Key Resistance Levels
In a tough global market, China provided some gold support by adding to reserves for the second month in a row. The People’s Bank of China reported buying in December, gold demand from the world’s largest consumer is still strong.
Technically, gold is resistance at $2,665, then $2,680 and $2,700. The 50 period EMA at $2,637 is key support, then $2,618 and $2,596. The triangle on the charts is a breakout set up but market sentiment will depend on this week’s US macro data.
Outlook and Trading Opportunities
KCM Trade analysts say “any softness in US macro data this week could boost rate cut hopes for 2025” and that would be bullish for gold. But the neutral RSI and narrowing price action means traders are still hesitant.
Daily Technical Outlook: Gold Spot (XAU/USD) – January 8, 2025
Gold prices are consolidating near the $2,647 level after testing the 50-period EMA, currently at $2,637. The metal faces immediate resistance at $2,665, while stronger upside hurdles are seen at $2,680 and $2,700. On the downside, the $2,637 EMA aligns with immediate support, followed by $2,618 and $2,596. Gold’s trajectory suggests a tightening symmetrical triangle, signaling potential for a breakout.
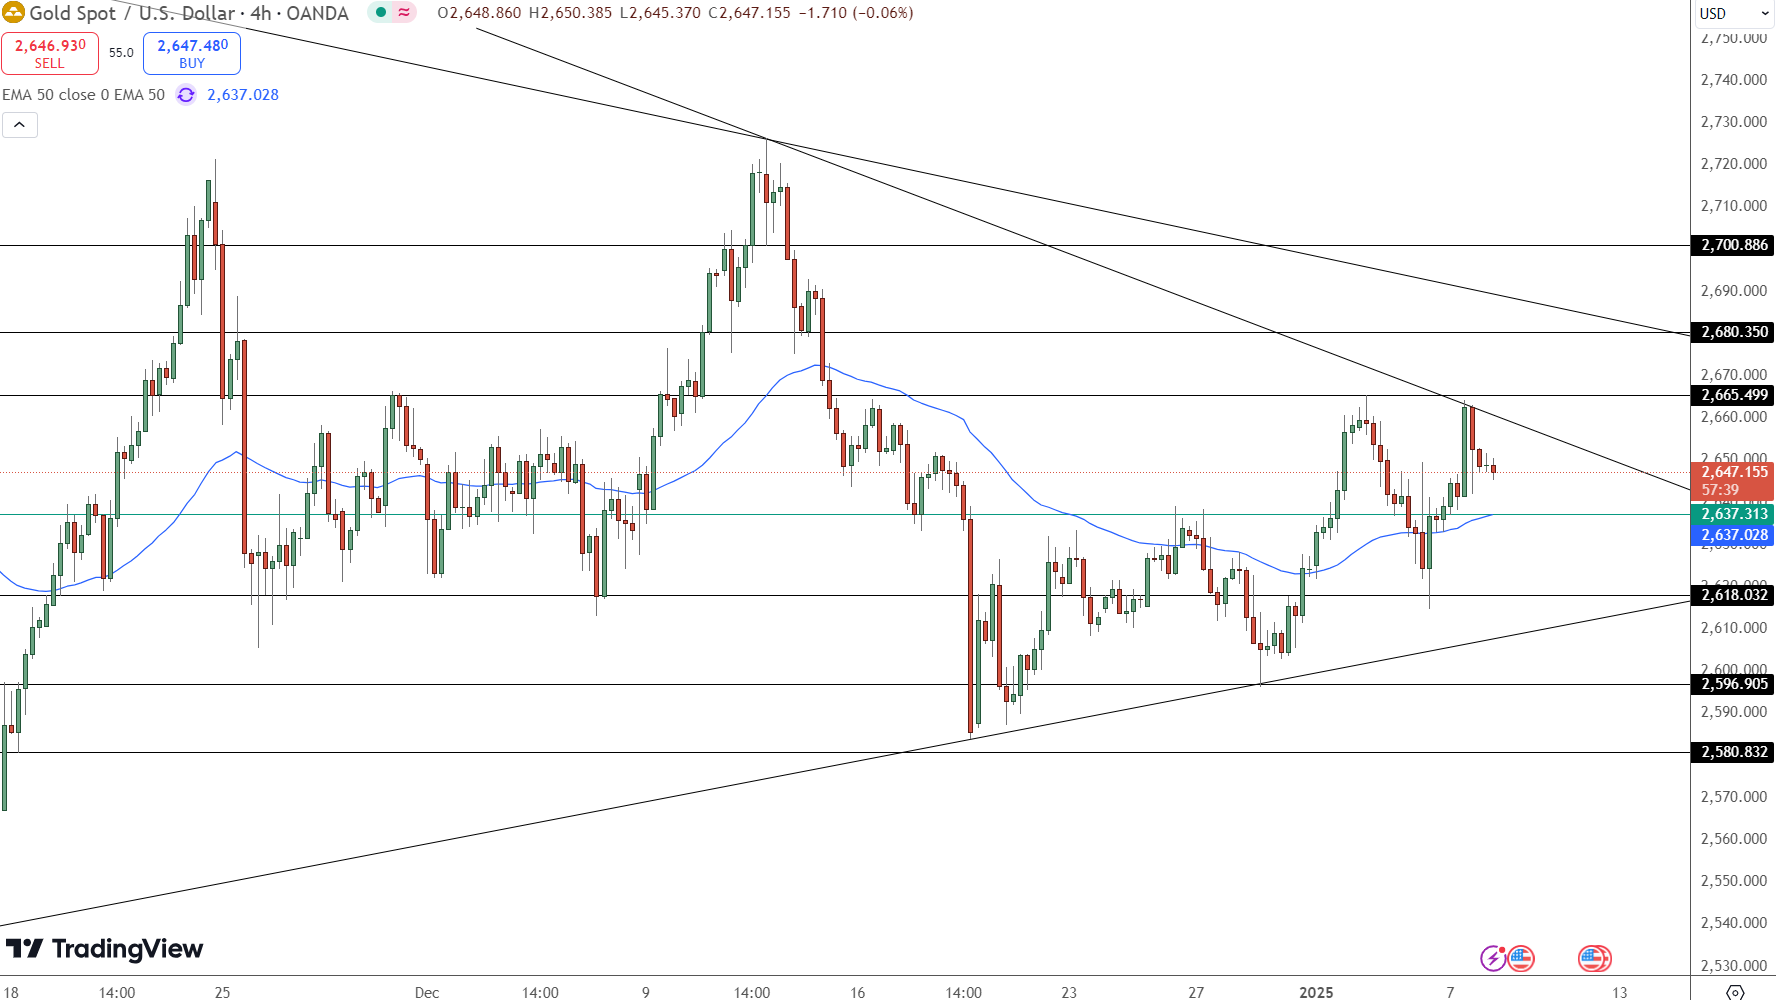
Momentum is muted as RSI hovers near neutral levels, reflecting indecision. The narrowing price action highlights investor caution ahead of economic data and geopolitical developments. A sustained break above $2,665 could accelerate bullish momentum, while a breach below $2,637 might lead to further weakness.
Key insights:
-
Immediate resistance levels: $2,665, $2,680, $2,700.
-
Immediate support levels: $2,637, $2,618, $2,596.
-
RSI remains neutral, signaling a lack of strong momentum.
For now, gold traders will closely monitor the release of the Fed’s December meeting minutes and ADP employment data later today for additional cues. A break above $2,665 could signal bullish momentum, while a breach below $2,637 may point to further downside.
- Check out our free forex signals
- Follow the top economic events on FX Leaders economic calendar
- Trade better, discover more Forex Trading Strategies
- Open a FREE Trading Account
- Read our latest reviews on: Avatrade, Exness, HFM and XM
Related Articles


Sidebar rates
Related Posts
