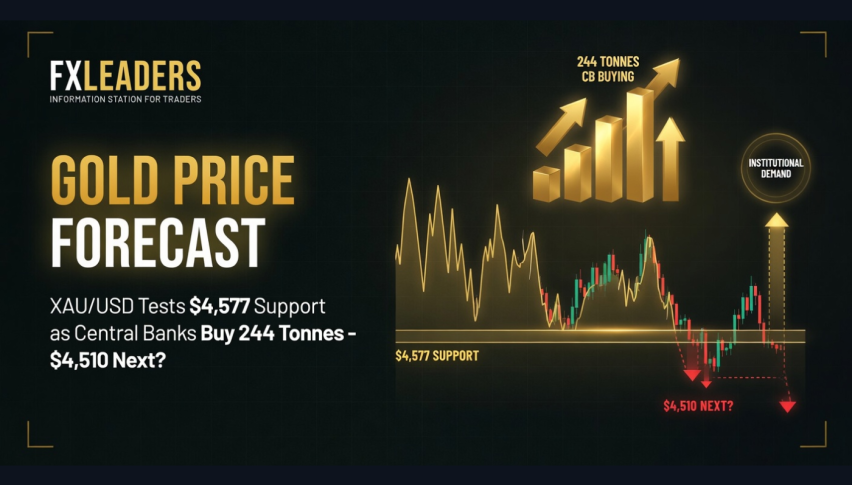
Gold Price Forecast: XAU/USD Tests $4,577 Support as Central Banks Buy 244 Tonnes – $4,510 Next?
As of May 4th 2026 (when the market first opened) spot gold (XAU/USD) is currently trading around $4577 per ounce, and it's looking...
Quick overview
- Spot gold (XAU/USD) is trading at $4577 per ounce, struggling to break the $4660 resistance level.
- Central banks have increased gold purchases by 3% year-on-year, totaling 244 tonnes in Q1 2026, with Poland and Uzbekistan leading the charge.
- Total gold demand reached a record high of 1,231 tonnes, driven by a 42% surge in investment in gold bars and coins, particularly from Asian countries.
- Gold jewelry sales have dropped by 23% due to high prices, while geopolitical tensions continue to support gold as a safe-haven asset.
As of May 4th 2026 (when the market first opened) spot gold (XAU/USD) is currently trading around $4577 per ounce, and it’s looking vulnerable after failing to get back above that key $4660 resistance zone once and for all.
Key Drivers to Watch Today
- The CBs Are Still Buying : Official purchases from central banks were quite healthy in Q1 2026, totalled 244 tonnes – thats a 3% increase year-on-year and 17% more than the previous quarter, according to the World Gold Council. Poland and Uzbekistan in particular have been leading the buying charge, as emerging market institutions continue to diversify their reserves in response to the growing trend of geopolitical fragmentation and the de-dollarization of international trade.
- A New Record for Gold Demand : Total gold demand (including off the books sales) rose by 2% year-over-year, to 1,231 tonnes, which was worth an all-time high of $193 billion – thats a whopping 74% higher than the same time last year. Investment in gold bars and coins surged by a massive 42% to 474 tonnes, the second-highest figure on record – and it was Asian countries like China and India that were driving this growth in demand.
- The not-so-good news : Sales of gold jewellery down 23% because the price is way too high, while gold-backed ETFs saw some modest inflows of 62 tonnes, albeit with U.S. funds actually selling off some of their gold in March.
- Global Tensions : The ongoing disruptions in the Strait of Hormuz and other tensions in the Middle East have kept the price of oil high and have a lot of people worried about inflation – and as a result, gold is getting a safe-haven bid. Analysts expect the central banks to keep on buying through 2026, and theyre predicting that the total amount of gold brought in by the CBs for the year will be somewhere in the range of 700 to 850 tonnes.
Gold (XAU/USD) Technical Picture
On the 4H chart, gold is under pressure, currently trading at $4577 after failing to climb back above the $4660 resistance zone – its clear now that this price level is now acting as a barrier that the price just cant get past.
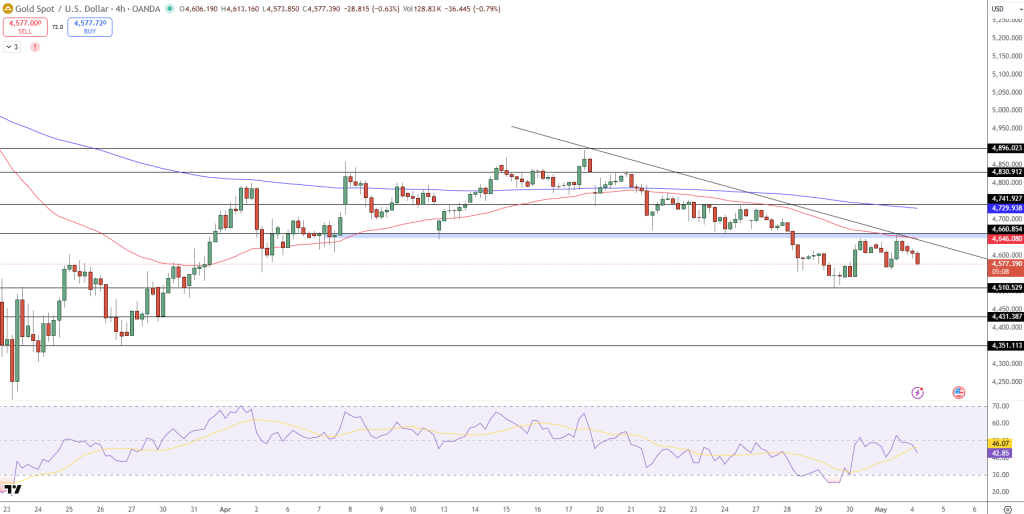
The price of gold is respecting a downward sloping trendline with lower highs – which is a pretty bearish sign – and repeated rejections near the 50 day EMA confirm that the short-term trend is definitely bearish.
The 200 day EMA is still sloping downwards, which reinforces the idea that were in a bit of a bear market at the moment. The RSI reading of 45 is telling us that momentum is weak, and there is no sign of a bullish divergance – which is further evidence that the sellers are still in control. The recent breakdown below the $4600 level is another sign that the bearish trend is likely to continue.
Key Levels to Watch
- Resistance: $4600 → $4660
- Support: $4510 → $4430
Trade Idea : Sell gold if it breaks below $4600, aiming for $4510 with a stop loss just above $4660.
- Check out our free forex signals
- Follow the top economic events on FX Leaders economic calendar
- Trade better, discover more Forex Trading Strategies
- Open a FREE Trading Account
- Read our latest reviews on: Avatrade, Exness, HFM and XM
Related Articles


Sidebar rates
Related Posts
