Paramount Stock Analysis: Is PSKY Massively Undervalued in 2026?

Paramount Skydance Corporation

Quick overview

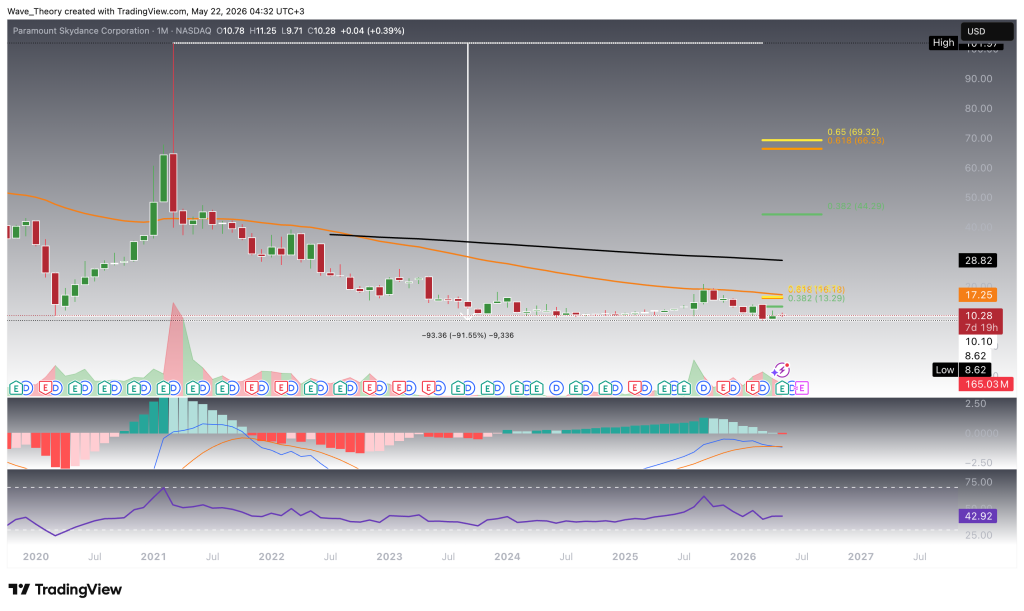
  • Paramount Skydance Corporation's stock has plummeted approximately 91.55% from its 2021 peak, reflecting severe long-term declines in the media sector.
  • The stock exhibits a predominantly bearish technical structure across multiple timeframes, with ongoing death crosses in the EMAs indicating sustained downside pressure.
  • Despite some signs of short-term momentum improvement, significant resistance levels remain, including the 50-week EMA at $12.20 and Fibonacci levels around $13.20 and $16.50.
  • Critical support is found between $8.62 and $10.10, and a breakdown below this zone could lead to further declines in the stock's value.

Paramount Skydance Corporation (NASDAQ: PSKY) has suffered one of the most devastating long-term declines in the media sector, with the stock collapsing roughly 91.55% from its 2021 all-time high near $102. Following years of persistent downside pressure driven by structural industry headwinds, declining linear television revenues, streaming profitability concerns, and deteriorating investor sentiment, the stock now finds itself trading near historically depressed valuation levels.

Death Cross Dominates Paramount’s Monthly Chart Structure

On the monthly timeframe, Paramount Skydance Corporation (NASDAQ: PSKY) continues to exhibit a predominantly bearish technical structure, with multiple long-term indicators still signaling sustained downside pressure despite the stock trading near historically depressed levels.

The MACD lines remain bearishly crossed on the monthly chart, reinforcing the continuation of the broader downward trend. At the same time, the MACD histogram continues to print a strong bearish downtrend, indicating persistent negative momentum and a lack of meaningful long-term bullish acceleration.

Further confirming the deteriorated macro structure, the EMAs continue to display a bearish death cross, which validates the long-term trend direction to the downside. This crossover reflects the sustained weakness that has dominated Paramount’s price action throughout its multi-year decline from the 2021 peak.

Meanwhile, the Relative Strength Index (RSI) continues to fluctuate within neutral territory, offering neither a decisive bullish nor bearish signal at current levels and suggesting that momentum remains directionally inconclusive despite the broader bearish structure.

Technically, Paramount stock faced a significant bearish rejection at the 50-month EMA near $17.25 several months ago, reinforcing this level as a major dynamic resistance zone within the broader downtrend. In addition, the stock now encounters critical Fibonacci resistance levels at approximately $13.20 and $16.50, both of which continue to act as important barriers to any sustained recovery attempt. The 50-month EMA at $17.25 further strengthens this resistance cluster.

However, should Paramount stock manage to decisively break above this entire resistance region, the next major upside target would emerge at the 200-month EMA near $29 — a level that could become technically achievable in the event of a broader long-term trend reversal and improving momentum structure.

Paramount
Paramount

Paramount Stock Trades Within a Parallel Downward Channel on the Weekly Chart

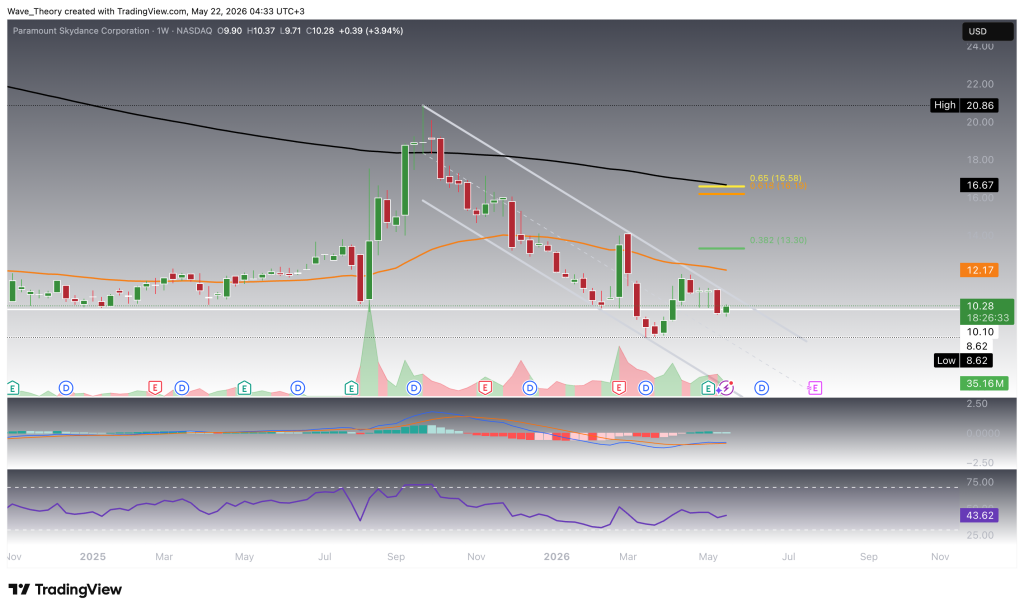
On the weekly timeframe, Paramount Skydance Corporation (NASDAQ: PSKY) continues to trade within a well-defined parallel downward channel, reinforcing the persistence of the broader bearish market structure despite intermittent recovery attempts.

From a momentum perspective, the MACD lines remain bullishly crossed for now, indicating that some residual upside momentum is still present within the current consolidation phase. However, the technical structure has started to weaken noticeably, as the MACD histogram has been ticking bearishly lower since last week. This deterioration in momentum suggests that the bullish MACD crossover could soon transition into a bearish crossover if selling pressure continues to build.

At the same time, the EMAs continue to display a bearish death cross on the weekly chart, confirming that the mid-term trend structure remains decisively bearish. This aligns with the broader macro downtrend that has dominated Paramount’s price action over recent years.

Meanwhile, the Relative Strength Index (RSI) continues to fluctuate within neutral territory, offering no clear directional bias and reflecting the ongoing equilibrium between buyers and sellers within the current consolidation range.

Should Paramount stock initiate a meaningful recovery attempt from current levels, the first major resistance emerges at the 50-week EMA near $12.20. Beyond that, a significantly stronger resistance zone is located near $16.70, where the golden ratio Fibonacci resistance converges with the 200-week EMA, creating a major technical confluence area likely to attract substantial selling pressure.

To the downside, Paramount stock continues to find significant support within the broader demand zone between $8.62 and $10.10. As long as this support region holds, the stock may continue consolidating within its downward channel structure. However, a decisive breakdown below this zone could substantially increase the probability of continued downside expansion within the broader long-term bearish trend.

Paramount
Paramount

Mixed Signals Continue to Dominate Paramount’s Daily Chart Structure

On the daily timeframe, Paramount Skydance Corporation (NASDAQ: PSKY) continues to present a mixed technical outlook, as bearish trend structures remain intact while short-term momentum indicators begin to show early signs of stabilization.

The EMAs continue to display a bearish death cross on the daily chart, confirming that the short- to medium-term trend structure remains tilted to the downside. This reflects the persistent weakness that continues to dominate Paramount’s broader price action despite recent consolidation attempts.

In addition, the MACD lines remain bearishly crossed, reinforcing the prevailing bearish momentum structure on the daily timeframe. However, despite the bearish crossover remaining active, the MACD histogram has been ticking bullishly higher over the past three consecutive days, indicating that downside momentum may gradually be weakening in the near term and that a potential short-term recovery attempt could begin to develop.

Meanwhile, the Relative Strength Index (RSI) continues to fluctuate within neutral territory, offering neither a decisive bullish nor bearish directional signal at current levels.

Overall, the daily chart suggests that while Paramount stock remains technically bearish from a trend-following perspective, improving short-term momentum dynamics could signal the early stages of stabilization following the prolonged decline. Nevertheless, a confirmed bullish reversal would still require substantially stronger momentum confirmation and the recovery of key resistance levels on higher timeframes.

Paramount
Paramount

Similar Outlook on the 4H Chart

On the 4-hour chart, Paramount stock shows mixed short-term signals. The MACD lines have crossed bullishly, while the MACD histogram continues to trend higher, indicating improving short-term momentum. Meanwhile, the RSI remains neutral and provides no clear directional bias.

However, the EMAs continue to display a bearish death cross, confirming that the short-term trend structure remains tilted to the downside. To the upside, Paramount could face immediate resistance at $10.50 and $11.40, whereas renewed selling pressure could push the stock back toward its recent low near $8.62.

Paramount
Paramount

Paramount Stock Analysis Summary & Key Levels

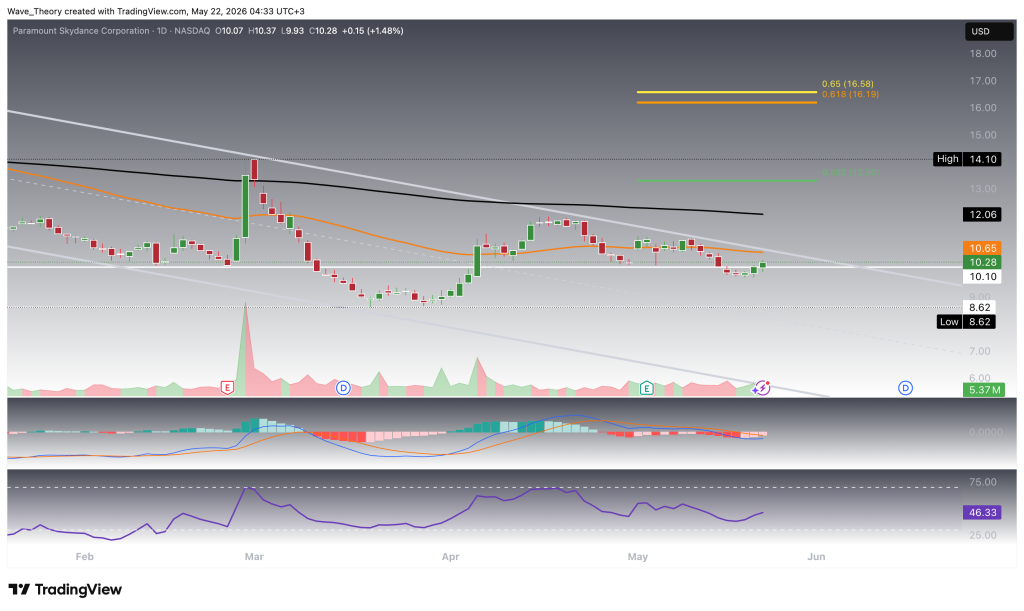
Paramount Skydance Corporation (NASDAQ: PSKY) continues to trade within a dominant long-term bearish structure after collapsing more than 91% from its 2021 all-time high near $102. Across the monthly, weekly, and daily timeframes, the EMAs continue to display bearish death crosses, confirming persistent downside trend pressure despite recent stabilization attempts.

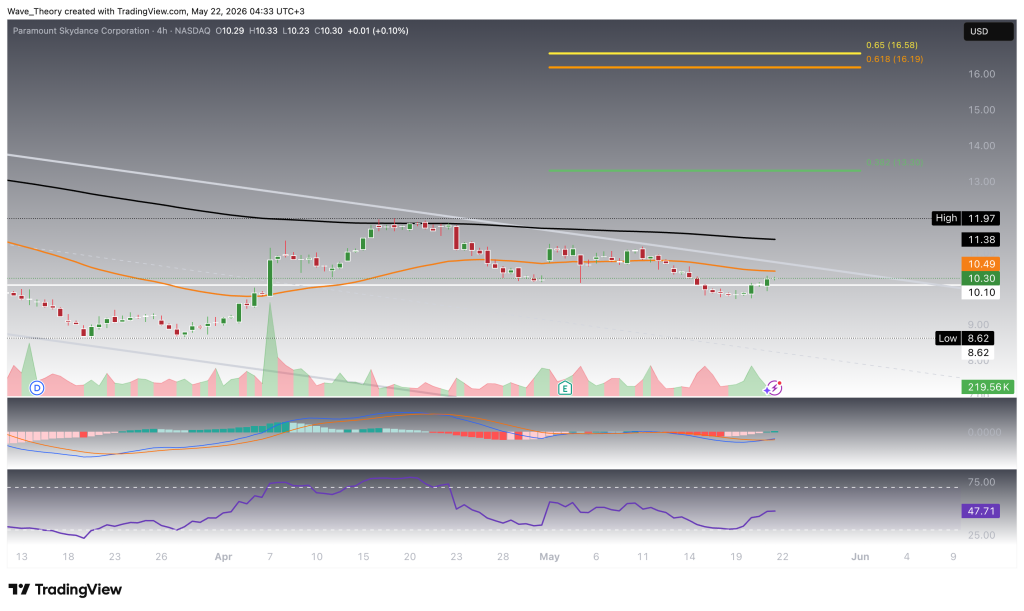
While short-term momentum indicators — particularly on the 4H chart — have started to improve modestly, the broader technical structure remains fragile. The MACD histogram has recently shown signs of recovery on lower timeframes, but higher timeframe momentum continues to deteriorate overall.

Technically, Paramount faces major resistance levels at:

  • $10.50
  • $11.40
  • the 50-week EMA near $12.20
  • Fibonacci resistances near $13.20 and $16.50
  • and the major confluence resistance near $16.70, where the golden ratio meets the 200-week EMA.

A confirmed breakout above this broader resistance cluster could open the path toward the 200-month EMA near $29 and potentially mark the beginning of a larger recovery phase.

To the downside, Paramount continues to find critical support between $8.62 and $10.10. A breakdown below this region would likely reinforce the broader bearish structure and increase the probability of further downside continuation.

ABOUT THE AUTHOR See More
Konstantin Kaiser
Financial Writer and Market Analyst
Konstantin Kaiser comes from a data science background and has significant experience in quantitative trading. His interest in technology took a notable turn in 2013 when he discovered Bitcoin and was instantly intrigued by the potential of this disruptive technology.

Related Articles

HFM

HFM rest

Pu Prime

XM

Best Forex Brokers