WTI Crude Oil Price Analysis: Oil Surges 4.6% to $94.48 as Iran Rejects Peace Talks – Is $100 the Next Stop?
On March 27, 2026, WTI crude jumped 4.6% to $94.48 after Iran’s Foreign Minister rejected direct US peace talks, wiping out the previous...
Quick overview
- On March 27, 2026, WTI crude oil prices surged 4.6% to $94.48 following Iran's rejection of US peace talks, reversing previous optimism.
- The ongoing crisis, marked by the closure of the Strait of Hormuz and significant supply disruptions, is deemed the largest in market history.
- Technical analysis indicates a bullish trend for WTI, with key support levels and positive RSI signals suggesting potential price increases.
- Future oil prices remain uncertain, heavily influenced by geopolitical developments and the potential reopening of the Strait of Hormuz.
On March 27, 2026, WTI crude jumped 4.6% to $94.48 after Iran’s Foreign Minister rejected direct US peace talks, wiping out the previous day’s optimism. With the Strait of Hormuz still closed and OECD inventories 180 million barrels below average, oil is now the world’s most important commodity trade.
The Largest Oil Supply Disruption in Market History
This crisis is unlike anything seen before. After joint US-Israeli strikes on Iran began on February 28, Iran’s IRGC stopped all shipping through the Strait of Hormuz. This key route usually moves 20 million barrels a day, about 20% of the world’s seaborne oil.
The IEA calls this the biggest supply disruption ever, even worse than the 1970s oil crises when measured by barrels per day. Gulf producers have cut at least 10 million barrels a day. Rystad Energy estimates nearly 500 million barrels lost so far. US crude stockpiles are at their lowest since November 2022, and OPEC+ says there will be no output increases before the third quarter of 2026.
Insurance, not military force, is the real chokepoint. Shipping insurers have pulled coverage for trips through the Strait, which blocks traffic just as effectively as a physical blockade, but without any fighting at sea.
WTI Technical Analysis: Bullish Structure Holding Above Key Fibonacci Support
Even with all the geopolitical turmoil, WTI’s price chart still shows a clear technical pattern.
The price started its rally from the Fibonacci 100% level at $69.12, following a rising channel that has held up through several tests. Both EMAs turned bullish early and still show a positive trend. The sharp jump to $119 created a shooting star candle, which is a classic sign of a liquidity grab, before the price moved back into the Fibonacci range. The 38.2% level at $100.12 was the first resistance, and buyers stepped in near the 50% level at $94.20, which is close to today’s price.
The main signal to watch is the RSI. It’s at 56 to 58, both above the neutral 50 mark, and it held a higher low during the recent drop from $103 to $92. This shows clear bullish divergence, meaning selling pressure is fading even as the price tested support.
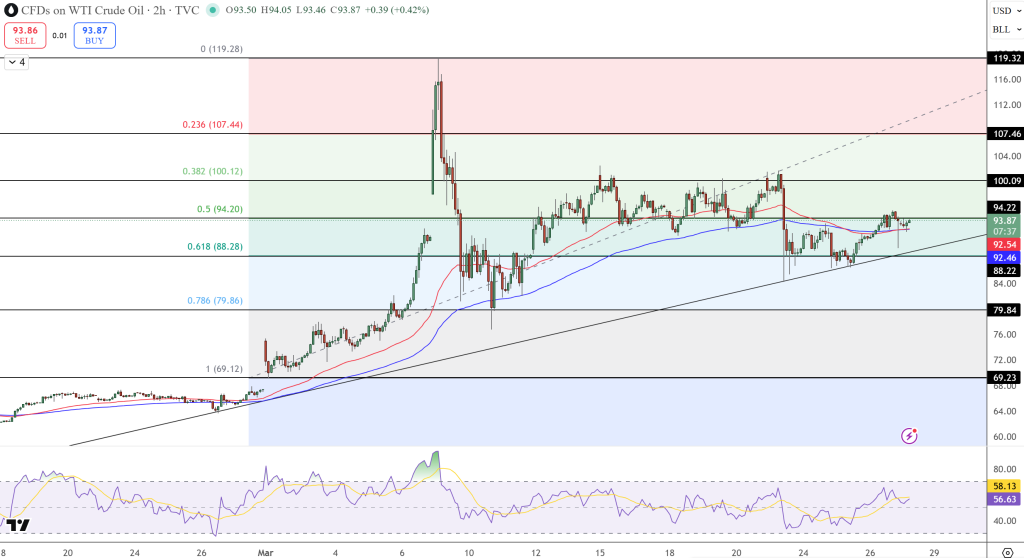
Trade idea (long): Buy if there’s a bullish engulfing pattern at the $92.46–$88.28 support zone. Place a stop below $86.00. Aim for $100.12 first, then $107.44 if the breakout continues.
One Diplomatic Headline Away From $100
Iran’s rejection of talks today took away the main reason for prices to fall. The EIA expects Brent to stay above $95 for the next two months, then drop toward $70 by year-end, but only if the Strait gradually reopens. According to the Dallas Fed, if the Strait stays closed through the second quarter, WTI will stay near $98. If the disruption lasts three quarters, global GDP could fall by 1.3 percentage points.
The biggest risk for higher prices is an attack on Saudi or UAE pipelines, since these are the only real alternative routes for Gulf oil. On the other hand, a credible ceasefire or renewed tanker confidence from US Navy escorts could push prices down.
Unless there’s real progress in diplomacy, oil prices are likely to keep rising.
FAQ: WTI Crude Oil – Strait of Hormuz Crisis Explained
Why is oil price rising in March 2026?
On March 27, Iran turned down direct US peace talks, which ended the previous day’s optimism and brought back worries about a long Strait of Hormuz closure. With inventories very low and no OPEC+ output increases expected before the third quarter, the market has little protection against more supply shocks.
What is the WTI crude oil price forecast for 2026?
Goldman Sachs predicts Brent will average $110 through March and April. The EIA expects Brent to stay above $95 through the second quarter, then fall toward $70 by year-end if the Strait reopens gradually. If the closure lasts more than two quarters, oil prices could go much higher.
What happens to oil prices if the Strait of Hormuz reopens?
The Dallas Fed’s models show that WTI would likely fall to around $68 per barrel in the quarter after the Strait reopens, as supply comes back and the risk premium quickly disappears.
- Check out our free forex signals
- Follow the top economic events on FX Leaders economic calendar
- Trade better, discover more Forex Trading Strategies
- Open a FREE Trading Account
- Read our latest reviews on: Avatrade, Exness, HFM and XM
Related Articles


Sidebar rates
Related Posts
