NVIDIA Stock Analysis: Record Earnings, Explosive AI Growth & China Risk

Quick overview
- Nvidia reported record Q1 FY2027 revenue of $81.6 billion, marking an 85% year-over-year increase.
- The company's gross margin expanded significantly to 74.9%, indicating strong pricing power and economic moat.
- Operating income surged to $53.5 billion, showcasing impressive operating leverage as revenue growth outpaced expenses.
- Despite strong fundamentals, mixed technical signals suggest potential momentum exhaustion and highlight key support levels to watch.
Nvidia recently published its earning report — Q1 FY2027 (May 20, 2026). Nvidia reported record revenue of $81.6 billion for Q1 FY2027 (quarter ended April 26, 2026), up 85% year-over-year. Data Center revenue hit a record $75.2 billion, up 92% from a year ago. The company also announced an $80 billion additional share repurchase authorization and raised its quarterly cash dividend from $0.01 to $0.25 per share.
Nvidia Stock revenue & growth momentum – looking at it from Warren Buffet’s perspective
Revenue came in at $81.6 billion, up 20% sequentially and 85% year-over-year. What matters here isn’t just the absolute number – it’s that this marks the third consecutive quarter of accelerating year-over-year growth. From a chart analyst’s perspective, that is the hallmark of a parabolic momentum phase, not a maturing growth curve. Buffett would look at this and ask: is this durable, or is it a cyclical spike? The honest answer is: it’s both. The secular AI infrastructure buildout is real, but the rate of growth will eventually mean-revert.
Gross margins – the Buffett litmus test
This is where Buffett spends most of his time. A company with a true economic moat defends its margins. Gross margin came in at 74.9%, essentially flat with Q4’s 75.0%, but a massive 14.4 percentage point expansion year-over-year compared to Q1 FY26’s 60.5%. That YoY margin jump is extraordinary — it signals that Nvidia’s pricing power is real and that the Blackwell architecture commands a significant premium. Buffett would love this. He’d note that companies without moats see margins compress as competitors pile in. Nvidia is doing the opposite.
Operating leverage – where the magic really is
Operating income surged from $21.6 billion to $53.5 billion, with operating margins reaching 66%. Total operating expenses rose from $3.9 billion to $7.6 billion across eight quarters, but operating leverage held as revenue scaled faster than costs throughout. This is textbook Buffett: revenue growing at 85% while opex grows at 52%. The gap between those two numbers is where economic value is being created. Every dollar of new revenue is dropping to the bottom line at an extraordinary rate.
Free cash flow – the real scoreboard
Buffett always says earnings can be manipulated, but cash is harder to fake. Quarterly free cash flow reached $49 billion, up from $35 billion in the prior quarter. Annualizing that, At the current quarterly pace, NVIDIA is operating at an implied annualized free cash flow run rate approaching $200B. That is an almost incomprehensible number for any company, let alone one still in a hypergrowth phase. This is why the $80 billion new share repurchase authorization and dividend raise from $0.01 to $0.25 per share are credible — they’re backed by real cash generation, not financial engineering.
The risk that keeps me up at night – China & export controls
Here is where the chart analyst diverges from the perma-bull narrative. Jensen Huang himself stated that “the $50 billion China market is effectively closed to US industry,” and that Q2 faces an $8 billion revenue hole from the H20 export ban. Q2 guidance explicitly excludes any China data center compute revenue, reflecting continued export licensing uncertainty. Buffett would flag this as an unquantifiable regulatory risk — the kind he typically avoids. The upside scenario is a policy reversal creating a multi-billion surprise; the downside is further tightening.
The inventory signal – watch this carefully
Inventory rose to $25.8 billion from $21.4 billion sequentially, and total supply-related commitments reached $119.0 billion. Rising inventory with surging revenue can mean two things: management is aggressively securing supply ahead of demand (bullish), or demand is softer than the headline suggests (bearish). Given DSO actually declined, I lean bullish here — but it’s a number to track quarter-over-quarter with discipline.
Concentration risk – the hyperscaler dependency
The most significant structural risk is that Nvidia’s largest customers – hyperscalers representing over 50% of data center revenue – are actively developing their own custom AI silicon. Buffett would call this the “toll bridge” question: will Nvidia remain the only road, or will customers build their own bridges? The CUDA ecosystem with 6 million+ developers is the moat, but it’s not impenetrable at multi-decade horizons.
Chart analysis: Bearish divergence on the monthly RSI
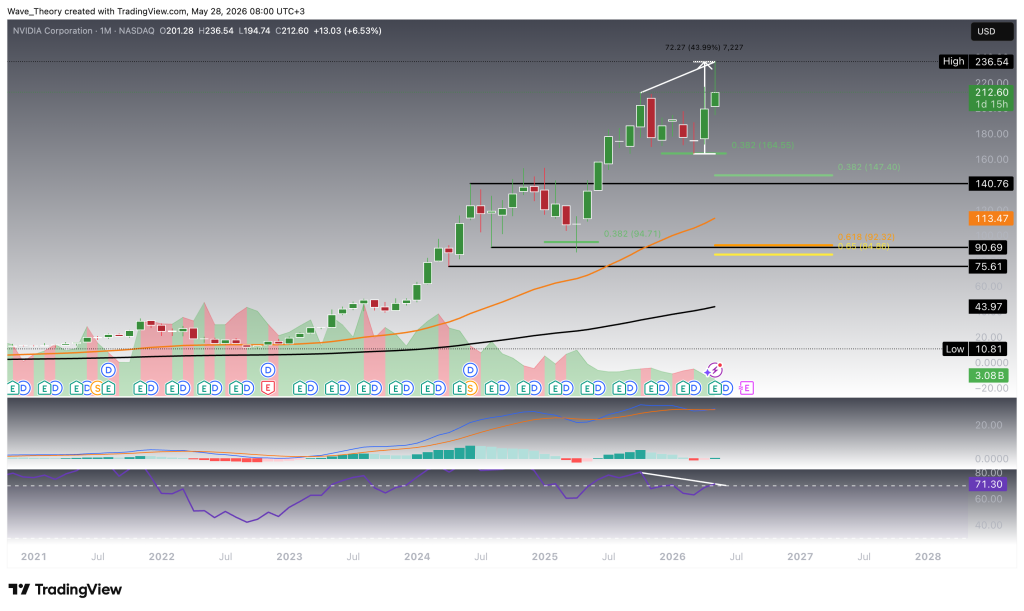
Over the past 2.5 years, NVDA has followed a remarkably consistent playbook on the monthly chart: each time price extends and begins to unwind, it has found its footing at the 0.382 Fibonacci retracement before resuming the primary uptrend. The most recent iteration played out between October and March – a clean sell-off from $213 down to the 0.382 support at $165, followed by a powerful impulse leg to a new all-time high of $236.50.
That high, however, carries a significant caveat. The monthly RSI has formed a massive bearish divergence against it – momentum deteriorating as price extends, a classic leading indicator of trend exhaustion at cycle peaks. Consistent with that warning, price has already retraced back to the October swing high at $213.
Should selling pressure accelerate, the technical map is well-defined. The 0.382 Fib at $165 is the primary demand zone, having held twice already. Below that, the 0.618 retracement at $147 becomes the deeper correction target. The 50-month EMA at $113.50 serves as the ultimate long-term dynamic floor – the level where institutional multi-year buyers would be expected to step in decisively.
Notably, not all indicators are flashing red. The MACD histogram continues to tick higher and the MACD lines remain in a bullish cross, while the EMAs are displaying a golden crossover – all of which confirm the long-term structural trend remains intact. The divergence is a warning shot, not a death sentence. The bull case lives as long as $165 holds.
Similar Outlook On Nvidia Stock’s Weekly Chart
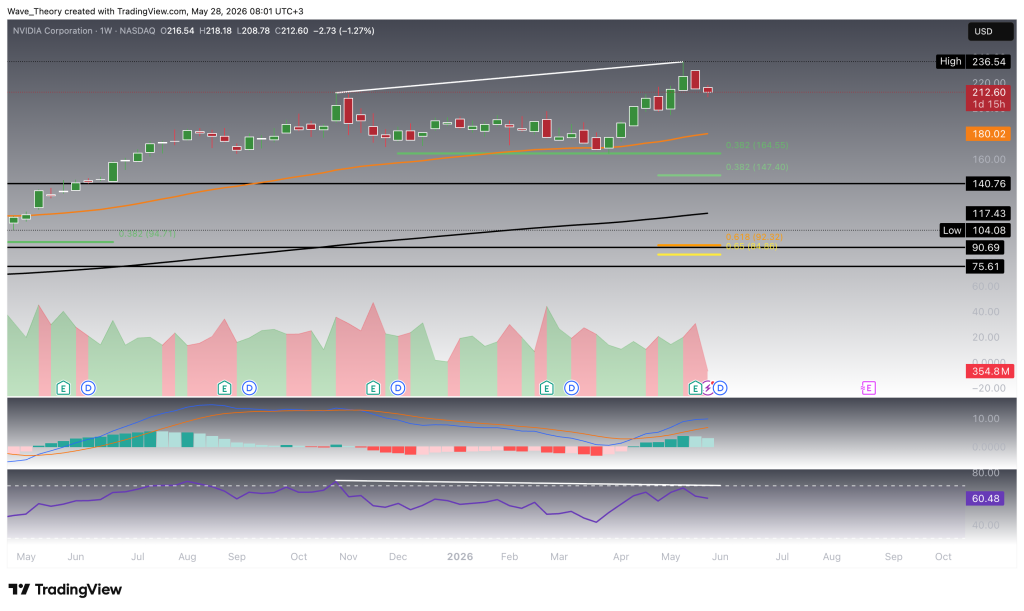
The weekly chart echoes the monthly’s cautionary tone with notable precision. The RSI is printing the same bearish divergence pattern, and the MACD histogram has now begun ticking lower – a fresh bearish development that adds short-term urgency to what the monthly was already signaling. Together, these two timeframes are aligned in their warning: momentum is fading faster than price action alone implies.
The bullish offsets remain present but are losing their persuasiveness at this juncture. The MACD lines hold their bullish cross and the EMAs continue to display a golden crossover, confirming the mid-term structural trend has not broken down.
The critical support level to watch on any extension of the current corrective move is the 50-week EMA, currently at $180. This level sits comfortably above the monthly Fibonacci supports at $165 and $147, meaning a test of $180 would represent a moderate, healthy pullback within the broader trend – not a structural breakdown. A decisive hold there would keep the bull case very much alive. A clean break below it, however, would open the door toward the $165 Fibonacci zone identified on the monthly chart, at which point the two timeframes would converge on the same support simultaneously – historically a high-conviction entry area for longer-term buyers.
Nvidia Stock Gives Mixed Signals on the Daily Chart
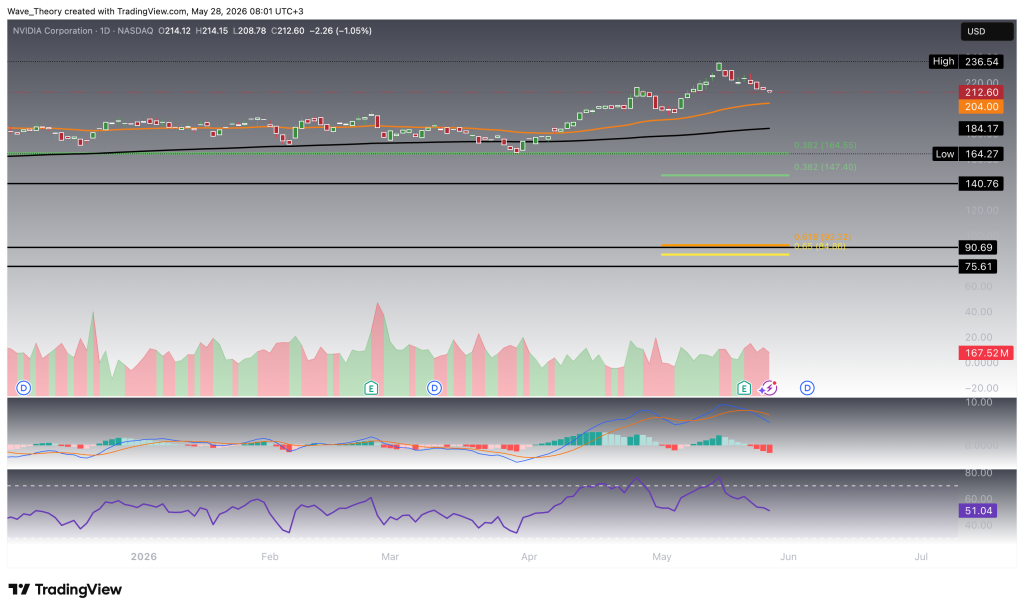
On the daily timeframe, NVIDIA stock (NASDAQ: NVDA) continues to present a mixed technical structure despite maintaining its broader bullish trend. The EMAs still display a bullish golden crossover, confirming that the short- to medium-term trend remains constructive from a trend-following perspective.
However, momentum indicators have started to weaken. The MACD lines remain bearishly crossed, while the MACD histogram continues to tick lower, signaling increasing short-term bearish momentum and weakening upside pressure following NVIDIA’s recent rally.
Meanwhile, the Relative Strength Index (RSI) continues to fluctuate within neutral territory, providing neither a clear bullish nor bearish directional signal at current levels.
Should NVIDIA extend its corrective movement, the stock finds significant Fibonacci support near $147, followed by another major support region around $90. In addition, the historical support zone between $75 and $91 continues to represent a critical long-term demand area that could attract substantial buying interest in the event of a deeper correction.
Nvidia Currently Finds Support at the 50-4H EMA
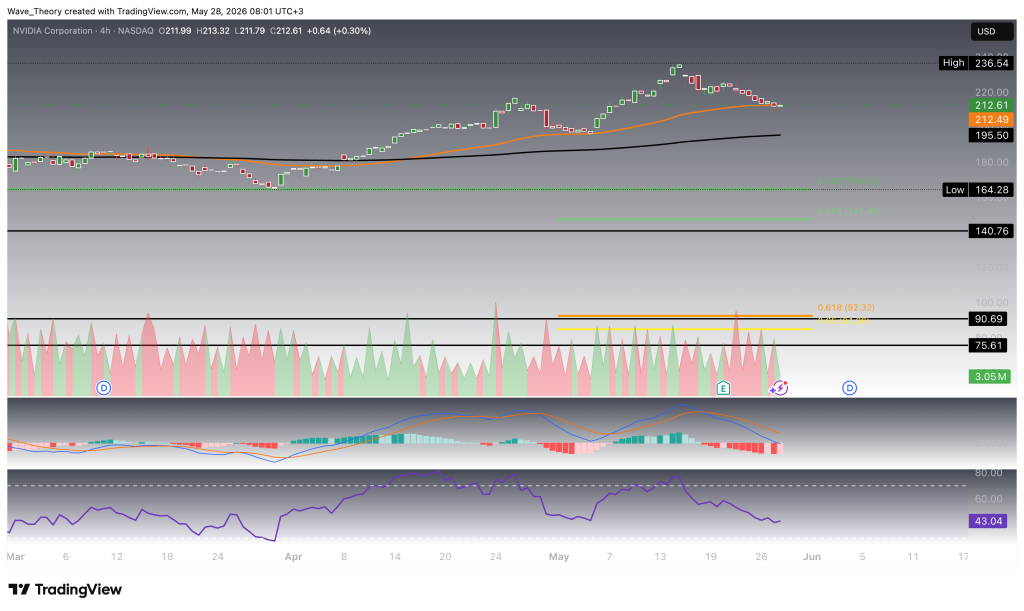
NVIDIA stock (NASDAQ: NVDA) is currently finding significant short-term support at the 50-period EMA on the 4-hour chart near $212.50, a level from which the stock could stage a strong bullish rebound if buyers continue defending the ongoing uptrend structure.
Should this support fail to hold, the 200-period EMA on the 4H chart near $195.50 emerges as the next major dynamic support level and could become a critical zone for maintaining the broader short-term bullish structure.
Overall, the indicators continue to present a predominantly bullish technical picture. The EMAs maintain a bullish golden crossover, confirming that the short-term trend remains constructive. Meanwhile, although the MACD lines are still bearishly crossed, the MACD histogram has started ticking bullishly higher again, signaling weakening downside momentum and a potential momentum reversal attempt. At the same time, the Relative Strength Index (RSI) continues to fluctuate within neutral territory, providing no clear directional bias at current levels.
Nvidia Stock Analysis Summary & Key Levels
NVIDIA (NASDAQ: NVDA) continues to exhibit one of the strongest fundamental growth profiles in market history, driven by explosive AI infrastructure demand, extraordinary operating leverage, and dominant pricing power within the data center market. Record Q1 FY2027 results — including $81.6 billion in revenue, 74.9% gross margins, and roughly $49 billion in quarterly free cash flow — reinforce the strength of NVIDIA’s economic moat and long-term structural positioning within the AI ecosystem.
From a technical perspective, however, momentum conditions are becoming increasingly mixed. Both the monthly and weekly charts are displaying significant bearish RSI divergences, historically one of the most reliable early warning signals of momentum exhaustion during late-stage trend extensions. At the same time, the MACD histogram has started weakening on higher timeframes, suggesting that upside momentum is beginning to cool following NVIDIA’s parabolic advance to new all-time highs near $236.50.
Nevertheless, the broader long-term trend structure remains intact. The EMAs continue to maintain bullish golden crossovers across multiple timeframes, while the MACD lines themselves remain bullishly crossed on the monthly and weekly charts. As a result, the current structure still resembles a corrective consolidation within a broader secular bull trend rather than a confirmed macro top.
The key support levels to watch are:
- $212.50 — 50-4H EMA support
- $195.50 — 200-4H EMA support
- $180 — 50-week EMA support
- $165 — critical 0.382 Fibonacci support and primary bull/bear inflection zone
- $147 — major 0.618 Fibonacci retracement support
- $113.50 — 50-month EMA and ultimate long-term dynamic support
- $75–91 — historical macro accumulation zone
As long as NVIDIA holds above the critical $165 Fibonacci support region, the long-term bullish structure remains firmly intact. However, a decisive breakdown below that level would significantly increase the probability of a deeper corrective phase toward the $147 and potentially even the $113.50 support region. On the upside, reclaiming and sustaining price action above the recent all-time high near $236.50 would invalidate much of the current bearish divergence structure and likely signal continuation of NVIDIA’s broader secular AI-driven uptrend.
- Check out our free forex signals
- Follow the top economic events on FX Leaders economic calendar
- Trade better, discover more Forex Trading Strategies
- Open a FREE Trading Account
- Read our latest reviews on: Avatrade, Exness, HFM and XM

Related Articles
Sidebar rates

Related Posts
 Save
SaveAva