Dell Technologies (DELL) Stock Parabolic Rise: 290% YTD Surge and 89% Two-Week Rally Explained

Dell stock

Quick overview

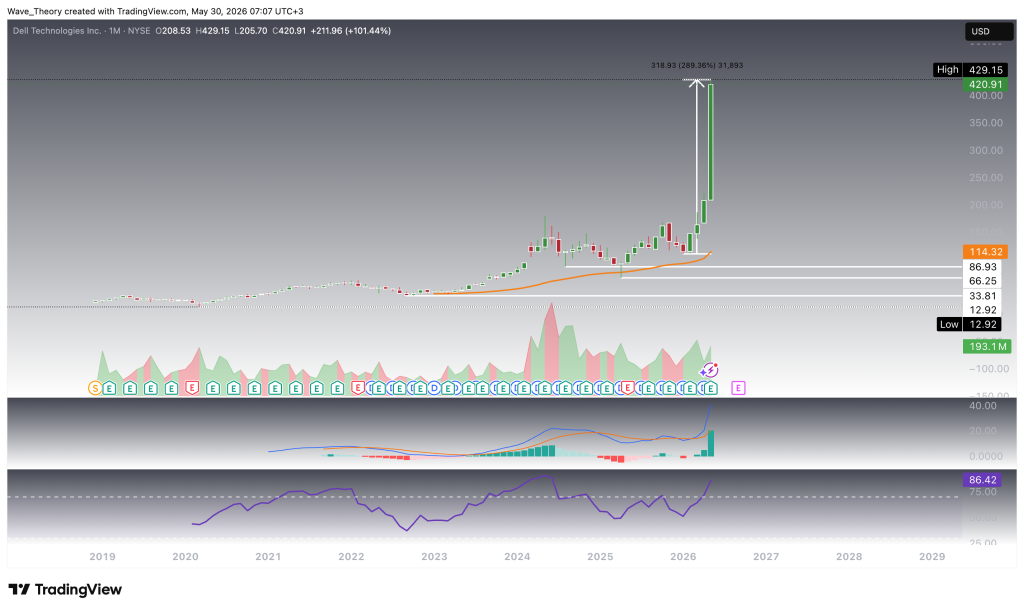
  • Dell Technologies has achieved a remarkable 290% gain year-to-date, with a recent surge of 89% in just two weeks.
  • The latest earnings report showed mixed results, with revenue beating estimates but non-GAAP EPS missing consensus due to margin pressures from AI server hardware.
  • Technical indicators across multiple timeframes remain bullish, suggesting sustained upside momentum despite the RSI being in overbought territory.
  • Key support levels are identified at $270 and between $160-$180, which are crucial for maintaining the overall bullish trend.

Dell Technologies has been one of the standout performers of the year, staging a remarkable 290% gain year-to-date – a return that would be exceptional in any asset class, let alone a large-cap technology name. The last two weeks alone have seen the stock tack on an additional 89%, compressing months of normal price discovery into a near-vertical parabolic move that has caught the attention of both momentum traders and fundamental desks alike.

Dell Technologies Earnings Report

Dell’s most recent earnings report was on May 28, 2026 – just two days ago. The Q1 FY2027 results were a mixed bag: revenue of $23.38 billion beat estimates by 0.8%, but non-GAAP EPS of $1.55 missed the $1.69 consensus by 8.4%, reflecting margin pressure from high-volume, lower-margin AI server hardware.

The standout number was AI demand: Dell generated $12.10 billion in AI orders during the quarter alone, exiting with a $14.40 billion AI backlog, while servers and networking revenue hit a first-quarter record of $6.32 billion — up 16% year-over-year.
DELL
DELL

Dell Stock Surges Nearly 89% in Just Two Weeks
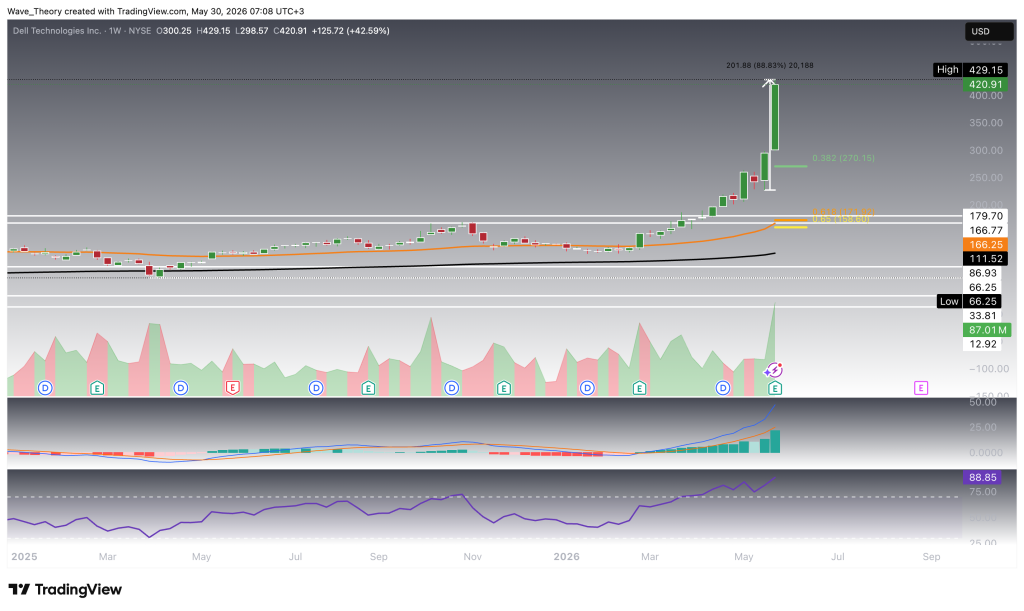
Dell Technologies (NYSE: DELL) has delivered an extraordinary rally over the past two weeks, with the stock surging approximately 89% during that period. Such a sharp advance has significantly strengthened the technical picture and pushed multiple trend indicators into bullish territory.

On the weekly chart, the EMAs have now formed a bullish golden crossover, confirming a constructive mid-term trend reversal and signaling growing upside momentum. In addition, the MACD lines remain bullishly crossed, while the MACD histogram has been ticking higher since last week, further reinforcing the strength of the ongoing advance and indicating accelerating bullish momentum.

Meanwhile, the Relative Strength Index (RSI) has entered overbought territory following the recent surge. However, despite elevated readings, the RSI is not yet generating a definitive bearish reversal signal and therefore continues to reflect strong underlying buying pressure.

Should Dell stock enter a corrective phase following its parabolic advance, the first major support level emerges at the 0.382 Fibonacci retracement near $270. A deeper pullback could bring the stock toward the golden ratio support around $160, where a significant technical confluence exists. This region is reinforced by the 50-week EMA and the historical support zone between $167 and $180, making it a critical area for bulls to defend in order to preserve the broader bullish trend structure.

DELL
DELL

Bullish Outlook on the Daily Chart

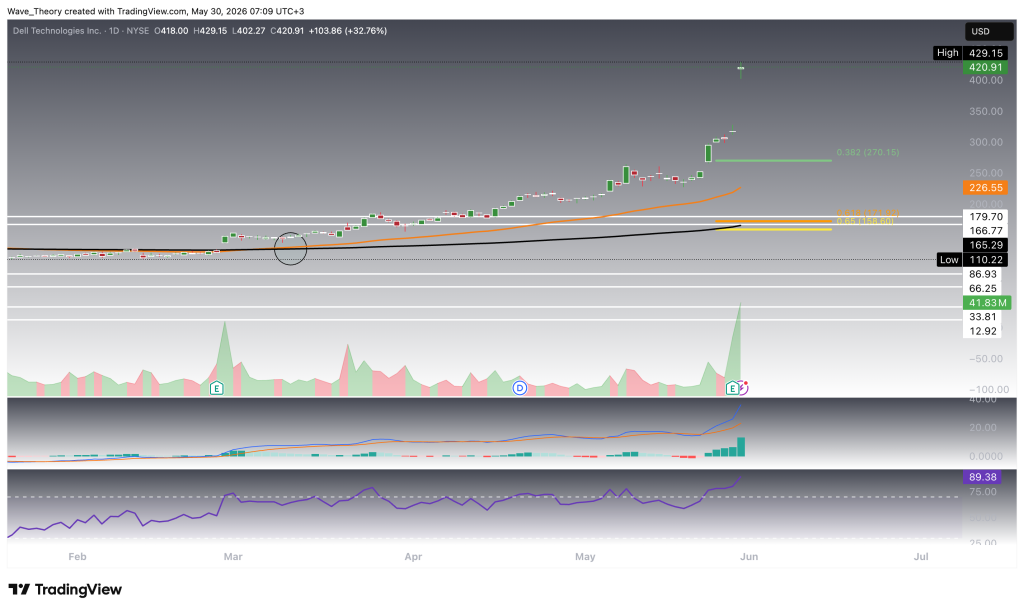
On the daily chart, Dell stock continues to exhibit a strongly bullish technical structure. The EMAs maintain a bullish golden crossover, confirming the short- to medium-term trend to the upside. In addition, the MACD lines remain bullishly crossed, while the MACD histogram has been ticking higher for several consecutive days, signaling strengthening upside momentum.

Meanwhile, the RSI remains in overbought territory following the recent rally but has yet to form a bearish divergence, suggesting that bullish momentum remains intact. Overall, the indicators continue to favor a continuation of Dell’s parabolic advance.

DELL
DELL

Similar Outlook on the 4H Chart

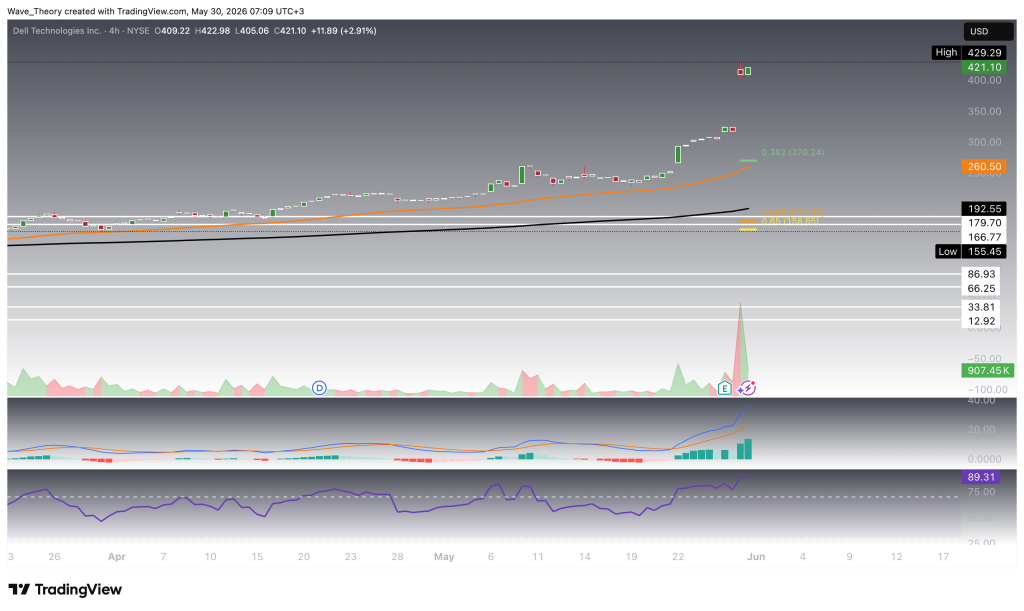
The 4-hour chart paints a similarly bullish picture for Dell stock. The EMAs continue to display a bullish golden crossover, confirming the short-term uptrend. In addition, the MACD lines remain bullishly crossed, while the MACD histogram continues to tick higher, reflecting strengthening bullish momentum.

Meanwhile, the RSI remains in overbought territory but has yet to generate any bearish reversal signals, suggesting that the rally still has momentum behind it.

Should Dell enter a corrective phase, the first major support level emerges at the 0.382 Fibonacci retracement near $270. Below that, the 50-period EMA on the 4H chart at approximately $260.50 provides additional dynamic support.
DELL

DELL

Dell Stock Analysis Summary & Key Levels

Dell Technologies (NYSE: DELL) has entered a powerful bullish phase, surging roughly 89% in just two weeks and confirming a major trend reversal across multiple timeframes. The technical structure remains overwhelmingly bullish, with golden crossovers on the weekly, daily, and 4-hour charts, while the MACD remains bullishly crossed and the MACD histogram continues to trend higher.

Although the RSI has entered overbought territory on both the daily and 4H charts, it has yet to form any bearish divergences, suggesting that momentum remains firmly on the bulls’ side and that the parabolic advance could continue in the near term.

Should Dell stock experience a healthy correction, the first major support level emerges at the 0.382 Fibonacci retracement near $270. Below that, the 50-4H EMA at $260.50 provides additional short-term support. For a deeper pullback, the most important support zone lies between $160 and $180, where the golden ratio support, the 50-week EMA, and a historical demand zone converge to create a strong long-term support cluster.

Overall, the trend remains decisively bullish across all analyzed timeframes. As long as Dell holds above the $270 support region, the path of least resistance remains to the upside, while the $160–180 zone represents the key long-term area bulls would need to defend to preserve the broader uptrend.

ABOUT THE AUTHOR See More
Konstantin Kaiser
Financial Writer and Market Analyst
Konstantin Kaiser comes from a data science background and has significant experience in quantitative trading. His interest in technology took a notable turn in 2013 when he discovered Bitcoin and was instantly intrigued by the potential of this disruptive technology.

Related Articles

HFM

HFM rest

Pu Prime

XM

Best Forex Brokers