Boeing Q2 2026 Earnings Preview: Delivery Ramp and FAA Milestone Test the Turnaround
Boeing reports Q2 2026 earnings July 28. Deliveries rise and FAA restores self-certification, but $47B debt and 787 bottlenecks linger.

Quick overview
- Boeing is expected to report a narrowed loss per share of -$0.28 to -$0.34 with revenues between $24.05 billion and $24.27 billion for Q2 2026.
- The company has seen a 14% year-over-year increase in commercial aircraft deliveries, reaching 171 units, while facing ongoing supply chain challenges with the 787 model.
- Wall Street maintains a Strong Buy consensus on Boeing stock, with a potential upside of 33% based on recent analyst ratings.
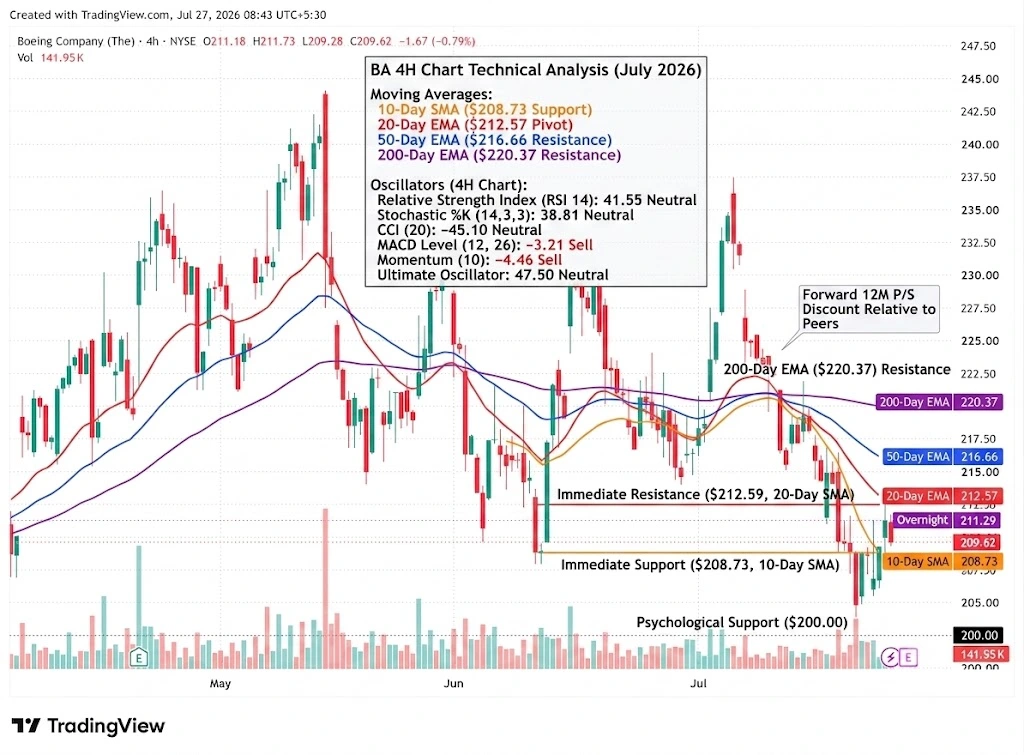
- Technical indicators suggest that BA stock is currently consolidating, with key support at $208.73 and resistance at $212.59.
The Boeing Company (NYSE: BA) is set to release its second-quarter 2026 financial results on Tuesday, July 28, before market open. Heading into the print, Wall Street anticipates a significantly narrowed loss per share of -$0.28 to -$0.34 on quarterly revenues of approximately $24.05 billion to $24.27 billion.
Supported by a 14% year-over-year surge in commercial aircraft deliveries (171 units) and the landmark restoration of FAA airworthiness self-certification authority, CEO Kelly Ortberg’s operational turnaround is showing measurable momentum. However, persistent 787 supply-chain bottlenecks and a $47.2 billion debt burden continue to test cash flow recovery.
Boeing’s Commercial Delivery Ramp vs. Supply Chain Headwinds
Boeing’s Q2 delivery figures provided an encouraging precursor to Tuesday’s financial release. Commercial airplane deliveries grew 14% year-over-year to 171 units, supported by stabilizing 737 production at 42 aircraft per month with active preparation to advance toward 47 per month.
Factory efficiency checks reveal a 20% reduction in final assembly rework hours for the 737 line and a >25% improvement on the 787 assembly floor, indicating that operational reintegration (including Spirit AeroSystems) is beginning to lower manufacturing costs.
(Sources: Zacks Investment Research, TipRanks, AlphaStreet, Company Filings)
Key Operational Drivers
-
FAA Self-Certification Restoration: Effective July 20, 2026, the Federal Aviation Administration (FAA) restored Boeing’s authority to issue final airworthiness certificates for all newly built 737 MAX and 787 jets. The regulatory milestone removes a key operational bottleneck, accelerating delivery velocity and cash conversion.
-
Order Momentum & Backlog: Commercial commitments—including massive orders from SMBC Aviation Capital (100 jets), Riyadh Air, Philippine Airlines, and AerCap—have expanded Boeing’s total backlog to roughly $695 billion.
-
787 Engine & Seat Bottlenecks: Despite higher delivery volume, 787 Dreamliner shipments continue to experience delays tied to engine supply and premium seat certification, shifting some completed deliveries into late Q2 and Q3.
Boeing Earnings: Institutional Sentiment and Wall Street Expectations
Wall Street maintains a Strong Buy consensus rating on BA stock based on 13 Buys and 1 Hold assigned over the past three months, with an average price target of $278.73, a 33% potential upside.
-
UBS (Gavin Parsons – Buy, PT $285): Highlights a 59% YoY surge in Dreamlifter cargo flights during June as a leading indicator that commercial aircraft deliveries will accelerate sharply throughout H2 2026.
-
Baird (Peter Arment – Outperform, PT $300): Notes that June 737-MAX deliveries (42 units) demonstrate that production rate increases are on track, predicting a solid Q2 revenue beat.
-
Earnings ESP & Options Move: Zacks quantitative models reflect an Earnings ESP of -17.41%, indicating lingering risk of a near-term earnings miss. According to TipRanks’ Options Tool, traders are pricing in an implied post-earnings move of ±6.06%, elevated above Boeing’s historical four-quarter average post-earnings swing of 3.95%.
BA Technical Analysis: Oscillators and Moving Averages on 4H Chart
Technically, BA stock has experienced short-term consolidation heading into the report, closing at $209.52 (with overnight BOATS trading ticking up to $211.29). The equity is down about 5.4% over the past month, trading at a discount on a forward 12-month Price-to-Sales (P/S) basis relative to aerospace peers.
Technical Indicators Breakdown
-
Oscillators: The 4-hour Relative Strength Index (RSI 14) sits neutral at 41.55, while Stochastic %K (38.81) and CCI (-45.10) reflect a balanced, non-oversold setup. MACD (-3.21) and Momentum (-4.46) maintain a short-term Sell signal.
-
Moving Averages: BA trades slightly below its 20-day EMA ($212.57), 50-day EMA ($216.66), and 200-day EMA ($220.37), setting up clear overhead resistance clusters.
-
Key Support & Resistance Levels
-
Immediate Support: $208.73 (10-Day SMA), followed by $200.00 (psychological support).
-
Immediate Resistance: $212.59 (20-Day SMA), followed by $216.66 (50-Day EMA) and $220.00 (100-Day SMA / 200-Day EMA zone).
-
How to Trade Boeing (BA) Earnings This Week
For traders evaluating BA this week, the primary focal point goes beyond headline EPS to free cash flow generation and production rate commentary.
Strategic Trading Scenarios
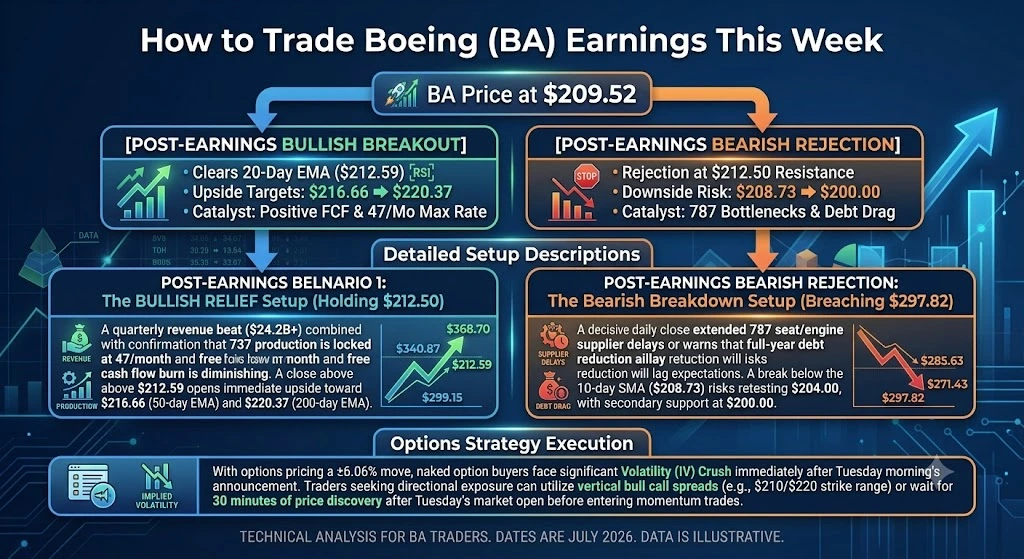
The Post-Earnings Bullish Breakout (Clearing $212.50)
A quarterly revenue beat ($24.2B+) combined with confirmation that 737 production is locked at 47/month and free cash flow burn is diminishing. A close above $212.59 opens immediate upside toward $216.66 (50-day EMA) and $220.37 (200-day EMA).
The Bearish Rejection (Breaching $208.70)
Management cites extended 787 seat/engine supplier delays or warns that full-year debt reduction will lag expectations. A break below the 10-day SMA ($208.73) risks retesting $204.00, with secondary support at $200.00.
Options Strategy Execution
With options pricing a ±6.06% move, naked option buyers face significant Volatility (IV) Crush immediately after Tuesday morning’s announcement. Traders seeking directional exposure can utilize vertical bull call spreads (e.g., $210/$220 strike range) or wait for 30 minutes of price discovery after Tuesday’s market open before entering momentum trades.
- Check out our free forex signals
- Follow the top economic events on FX Leaders economic calendar
- Trade better, discover more Forex Trading Strategies
- Open a FREE Trading Account
- Read our latest reviews on: Avatrade, Exness, HFM and XM

Related Articles


Sidebar rates

Related Posts
 Save
SaveAva