Clearfield Stock (CLFD) Bullish Setup: Bullish Bounce Imminent?

Quick overview
- Clearfield (CLFD) has experienced an 83% decline from its all-time high, now trading around the 200-month EMA, a key long-term support level.
- Despite a bearish trend, momentum indicators suggest that downside pressure is easing, indicating a potential reversal could be on the horizon.
- The stock's next major upside targets are the 50-month EMA at approximately $38 and Fibonacci resistance at $65.45, while downside risks remain if current support levels fail.
- A confirmed breakout above the descending channel and the 50-day EMA could signal the start of a larger recovery for Clearfield.
Clearfield (NASDAQ: CLFD) has endured a prolonged bear market since peaking above $134 in 2022 as demand for fiber broadband equipment slowed following the post-pandemic expansion cycle. Despite the significant correction, the stock has now entered an area where multiple long-term technical support levels converge, raising the possibility that a cyclical bottom is beginning to form.
After declining 83% from its all-time high, CLFD is now trading directly around its 200-month EMA while repeatedly defending long-term horizontal support. Although the higher timeframe trend remains bearish, momentum indicators suggest downside pressure is fading as investors watch for confirmation of a larger reversal.
Clearfield Finds Strong Long-Term Support at the 200-Month EMA
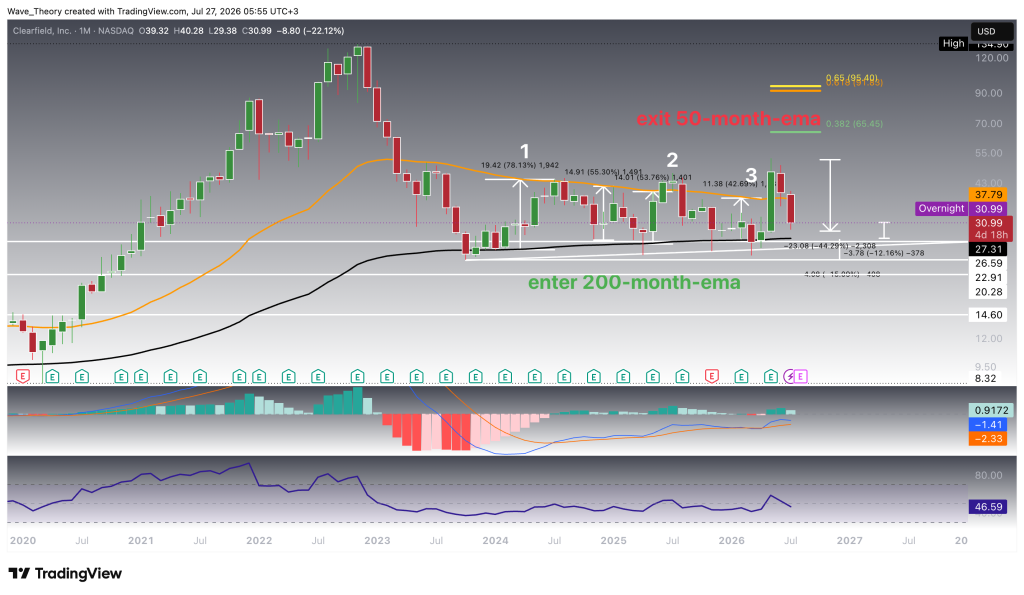
On the monthly chart, Clearfield has corrected 83% from its all-time high near $134.96 and is now testing one of its most important long-term support zones.
The stock is currently trading directly around the 200-month EMA, which has acted as major structural support throughout the company’s public trading history. At the same time, CLFD continues holding above the horizontal support zone between $26.59 and $27.31, creating a strong area of technical confluence. Should this support fail, the next major downside target lies at $22.91, followed by $20.28 and $14.60.
On the upside, the first significant Fibonacci resistance sits at the 0.382 retracement around $65.45. Above that, the Golden Ratio resistance zone awaits between $91.83 and $95.49.
Clearfield stock has rebounded off the 200-month EMA on three separate occasions, with each rebound subsequently driving the price toward or above the 50-month EMA and producing gains ranging from 42% to 78%. This pattern could repeat once again. Should the 200-month EMA continue to hold as support, it could present an attractive long-term entry opportunity, with the 50-month EMA serving as the initial upside target. Such a move would imply potential gains of roughly 36%.
Momentum indicators are giving mixed signals on the monthly chart. The MACD histogram has started ticking bearishy lower this month while the MACD lines remain bullishly crossed. Meanwhile, the RSI remains in neutral territory. The EMAs structure still displays a golden crossover, confirming that the primary trend remains bullish despite the stock’s multi-year drawdown.
Weekly Chart Shows Bears Losing Momentum
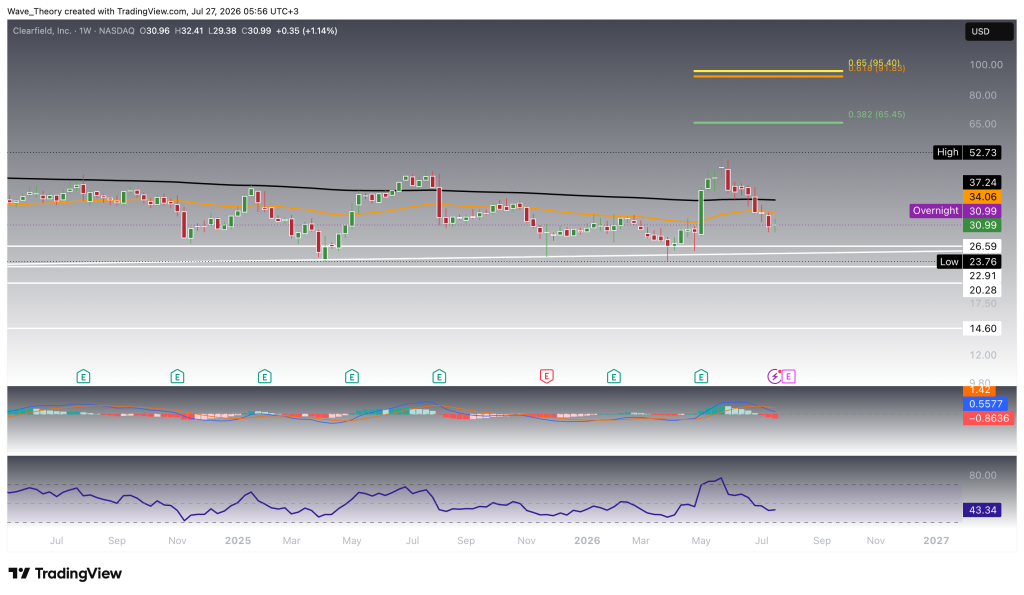
On the weekly timeframe, Clearfield remains below both the 50-week EMA at $34.06 and the 200-week EMA at $37.24, keeping the medium-term trend bearish.
However, the recent decline has slowed considerably after the stock successfully defended the support zone between $22.91 and $26.59. This level has repeatedly attracted buyers throughout the past year and continues serving as the most important short-term support.
If CLFD manages to reclaim the 50-week EMA, the next upside target remains the 0.382 Fibonacci resistance at $65.45. Above that, the Golden Ratio resistance zone between $91.83 and $95.49 represents the next major technical hurdle.
Momentum remains mixed. The MACD histogram continues ticking lower, while the MACD lines remain bearishly crossed. The RSI stays in neutral territory, leaving room for movement in either direction. The weekly EMA structure continues displaying a death cross, confirming that bears still control the medium-term trend.
Daily Chart Tests Falling Channel Resistance
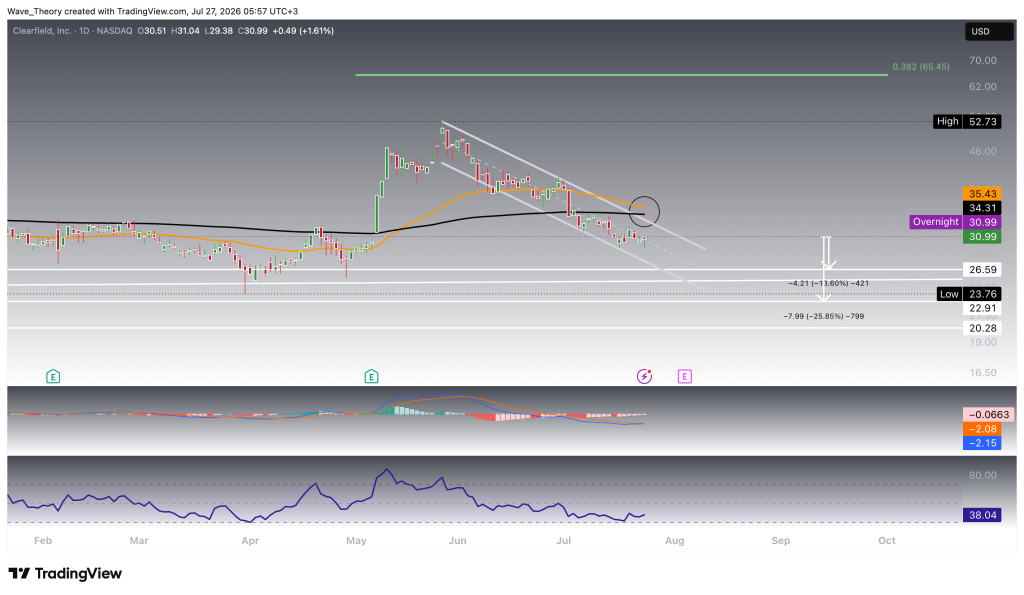
On the daily chart, Clearfield has spent the past several months trading inside a well-defined descending channel following its strong rally toward $52.73.
Most recently, the stock attempted to break above the upper channel boundary but encountered resistance precisely where the falling trendline intersects with the 50-day EMA around $35.43. As long as CLFD remains below this confluence resistance, sellers retain the short-term advantage.
Should another rejection occur, the first important support remains at $26.59, followed by $22.91 and $20.28. That implies downside of 13% to 26%. A confirmed breakout above the descending channel would significantly improve the technical outlook and could trigger a larger recovery toward the 0.382 Fibonacci resistance at $65.45.
The MACD histogram has started ticking higher while the MACD lines remain bearishly crossed, indicating that bearish momentum is gradually fading. The RSI remains in neutral territory, leaving room for a larger directional move. The EMAs could potentially form a death cross, confirming the short to medium trend bearish.
4H Chart Suggests Short-Term Recovery Attempt
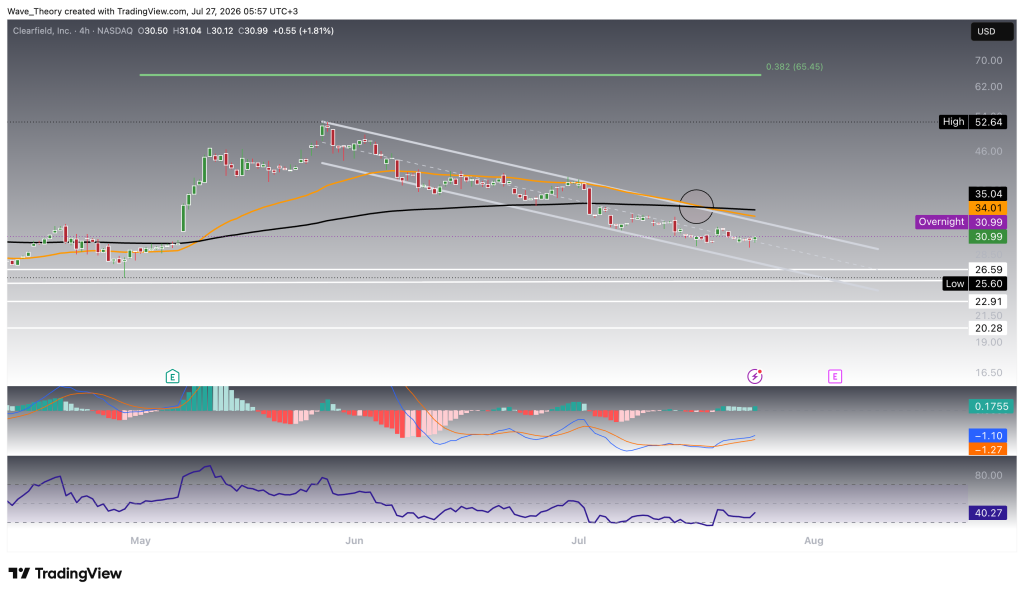
On the 4-hour chart, the EMAs have already established a death cross, confirming the trend bearishly in the short-term. Clearfield continues trading inside a shorter-term descending channel while attempting to stabilize near $31.
The stock recently rebounded after successfully defending the lower boundary of the channel and is now approaching resistance around the 50-4H EMA near $34.01, which closely aligns with the upper channel trendline. This area represents the first major obstacle bulls need to overcome.
A successful breakout above the descending channel would likely expose the 200-4H EMA near $35.04, followed by the much larger 0.382 Fibonacci resistance at $65.45. Failure to break higher could send the stock back toward support between $26.59 and $25.60, with additional downside toward $20.28 – $22.91 if selling pressure accelerates.
Momentum indicators are gradually improving. The MACD histogram continues ticking higher while the MACD lines have formed a bullish crossover, suggesting bullish momentum is building. The RSI remains in neutral territory, leaving sufficient room for additional upside.
Clearfield (CLFD) Price Prediction: Summary
Clearfield remains in a long-term downtrend, but the technical picture has started to improve as the stock trades directly around the 200-month EMA, one of the strongest long-term support levels on the chart. Multiple support zones between $26.59 and $27.31 continue holding, while momentum indicators across several timeframes suggest bearish momentum is gradually weakening.
The first major upside target remains the 50-month-EMA at roughly $38, followed by 0.382 Fibonacci resistance at $65.45 and Golden Ratio resistance zone between $91.83 and $95.49. On the downside, losing the current support zone could expose $22.91, followed by $20.28 and ultimately $14.60.
Although indicators give conflicted signals across timeframes, Clearfield appears to be building a technically significant base. Holding above the 200-month-EMA and the support zones underneath could be an excellent opportunity for a short-term bounce towards the 50-month-EMA.
A confirmed breakout above the descending channel and the 50-day EMA would substantially strengthen the bullish case and could mark the beginning of a larger medium-term recovery.
- Check out our free forex signals
- Follow the top economic events on FX Leaders economic calendar
- Trade better, discover more Forex Trading Strategies
- Open a FREE Trading Account
- Read our latest reviews on: Avatrade, Exness, HFM and XM

Related Articles
Sidebar rates

Ava